Tagged: Spider Chart
Ian Kinsler, the Chase Utley Alternative
By Tommy Rancel
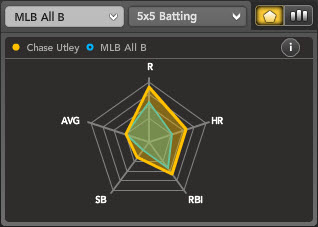
Since joining the Phillies lineup full-time in 2005, Chase Utley has averaged .301/.388/.535 (AVG/OBP/SLG) with 29 home runs and 101 RBI per season. These numbers are typical for a star corner outfielder or a slugging first baseman – not a second baseman. For example, in 2009, Utley hit .282/.397/.508 with 31 home runs and 93 RBI. The average full-time major league second baseman hit .283/.348/.446 with 17 home runs and 74 RBI last year.
Utley is a consistently elite performer who shows no signs of slowing down. But Ian Kinsler may soon pose a threat to his throne atop the second base rankings.
Kinsler one of baseball’s unluckiest players in 2009. His batting average on balls in play (BABIP) was just .241, the lowest BABIP among qualified major leaguers, and 47 points lower than his career mark of .288. This drop in BABIP led to career lows in batting average (.253) and on-base percentage (.327).
Kinsler posted a career high 54% fly-ball rate (FB%) last season, with a career-low 15.4% line drive rate (LD%). If he rebounds toward career levels (47.1% FB, 20.0 % LD) a healthy batting average regression will likely follow.
Despite the low batting average, Kinsler still had a productive season for the Texas Rangers, smoking 31 home runs and swiping 31 bases. He became just the third second basemen (Brandon Phillips and Alfonso Soriano) in major league history to record a 30/30 season.
Looking at the spider charts of Kinsler and Utley, both players rate above average across the board. Utley’s batting average looks a lot better, but remember Kinslers’ BABIP fluctuation.
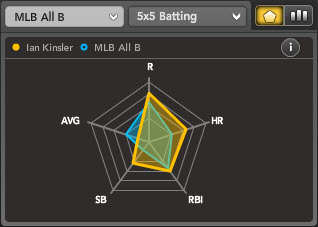
The final category is steals. Surprisingly, the 31-year-old, Utley stole a career high 23 bases last season after swiping 60 bags over the previous four. Kinsler has 91 career steals, including 80 over the past three years. He has increased his steals total in each of his four seasons: 11 in 2006, 23 in 2007, 26 in 2008, and 31 in 2009. Utley is on the wrong side of 30, while Kinsler is just 27; that age gap could widen the disparity in steals between the two players over the next few seasons.
One potential pitfall with Kinsler is health. In his four-year career he has spent 134 days on the DL with a variety of injuries. These include: a dislocated thumb, left foot stress fracture, sports hernia, and a strained hamstring last July. Utley missed 31 days with a broken bone in his hand in 2007, but has avoided a DL trip in the past two seasons.
Unlike previous years, Kinsler will not be leading off for the Rangers. This will give him fewer plate appearances, but should not be seen as a net negative. Instead, focus on all the increased RBI opportunities he will have hitting behind Michael Young and Josh Hamilton. In addition to the potential for more RBI, we know Kinsler’s power is real. His isolated power (slugging percentage minus batting average) has increased every season, going from .168 in 2006 to .235 in ’09.
B-Rank looks past Kinsler’s 2009 batting average and ranks him 12th overall; Utley ranks slightly higher at 10th overall. Meanwhile, Kinsler’s average draft position (ADP) of 17.2 means he could produce similar or better numbers than Utley (ADP 5.4) without expending a mid-first round pick.
In a 12-team mixed league, a team picking late in the first round could conceivably draft a combination of Prince Fielder and Kinsl
er, a killer 1-2 punch on the right side of the infield to start the draft.
For more information on Ian Kinsler and hundreds of other players, and for dozens of tools to help you dominate your fantasy league, check out Bloomberg Sports’ fantasy kits.
The Underrated Derek Lee in 2010
By Tommy Rancel
At a position stacked with superstar names, Chicago Cubs first baseman Derrek Lee is often overlooked. The best player on the face of the planet, Albert Pujols, plays the same position in the same division. So do sweet-swinging first basemen Prince Fielder, Lance Berkman, and Joey Votto.
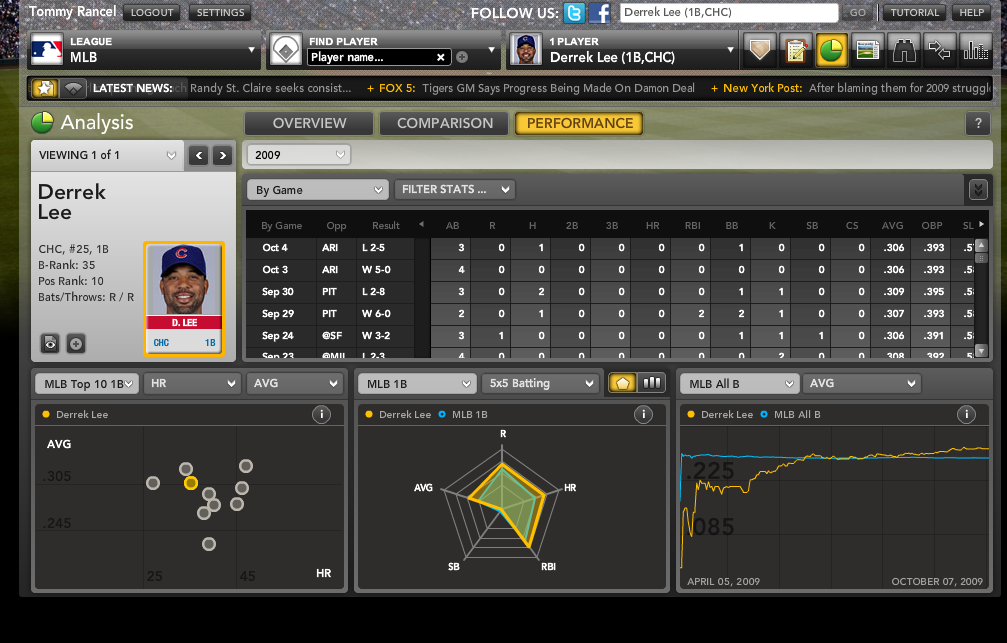
That Lee gets lost in the shuffle among other big hitters only makes him a more attractive pick. In 2009, he hit .306/.393/.579 (AVG/OBP/SLG) with 35 home runs, 111 RBI and 91 runs scored. His .972 OPS was fourth-best in the National League. The three names in front of him were all familiar foes: Pujols, Fielder and Votto.
Looking at Lee’s Spider Chart (bottom center), you can see the extent of his all-around contributions.
The biggest question facing Lee in 2010 is, can these numbers be sustained? It’s hard to envision a 34-year-old player duplicating such a great season.
When we look for flukes in a batter’s season, we often look at batting average on balls in p
lay (BABIP) and home run-to-fly ball ratios (HR/FB). In 2009, Lee had a BABIP of .327, well above league average, which typically hovers near .300. Lee’s career BABIP sits at .323, though, suggesting his ’09 figure isn’t unusual.
Lee’s career home run-to-flyball rate spiked to 17.9% in 2009, up from 11.7% In 2008. On the plus side, that ’08 figure represented a career low; Lee’s career HR/FB rate is 17%
With regression questions answered, we can look forward to the 2010 season. The most conservative projection on Lee in 2010 comes from the CHONE projection system. CHONE projects a slash line of .285/.365/.487. That would give him an OPS decline of .120 points compared to ’09 levels. Bloomberg Sports pegs Lee to hit .303/.386/.526. .
At these levels, Lee figures to slot in below some of the elite first basemen on baseball. But we’re still bullish on him, especially in 12-team mixed and deeper leagues. Here’s why.
Lee ranks 35th overall in B-Rank (Bloomberg’s proprietary ranking of all players). Despite the relatively high overall ranking, he is the 10th-rated first basemen. This is more a testament to the talent level at the position than Lee’s abilities. With such a deep pool of talent, it is essential to get a bargain at the position. Unless you’re able to score Pujols, Fielder, Ryan Howard or Mark Teixiera in the first round, you might want to lie in the weeds and snatch up Lee much later.
Average Draft Position shows Lee being taken at #90, making a 55-spot gap between where Bloomberg Sports ranks him and where people are drafting him. Looking at the Demand vs. Scarcity chart below, you’ll see that there are plenty of good first basemen available. But few have a bigger gap between their B-Rank and ADP than Lee.
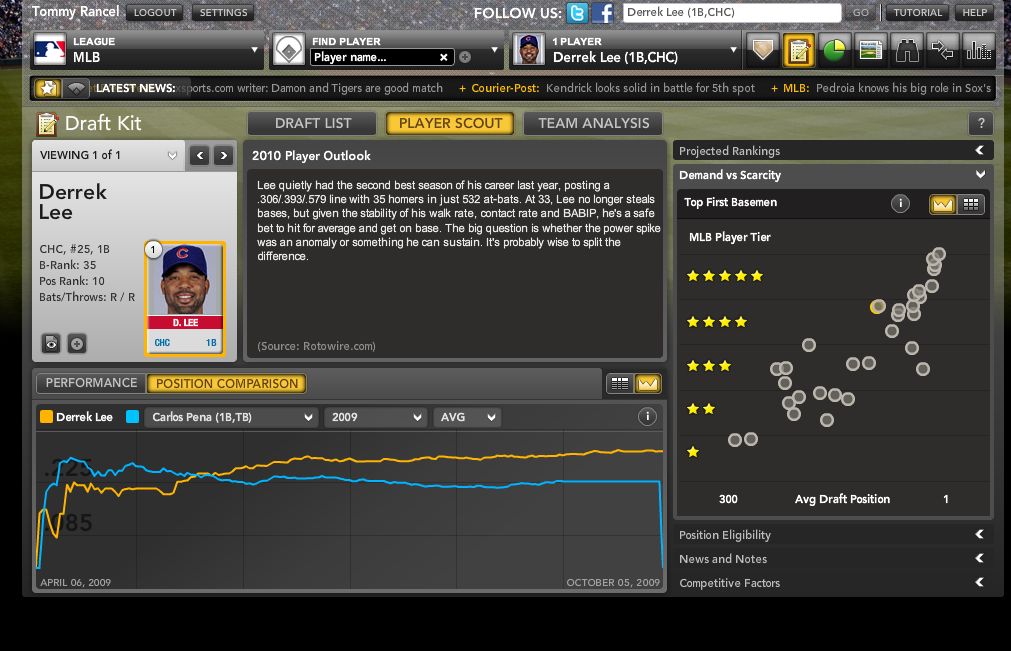
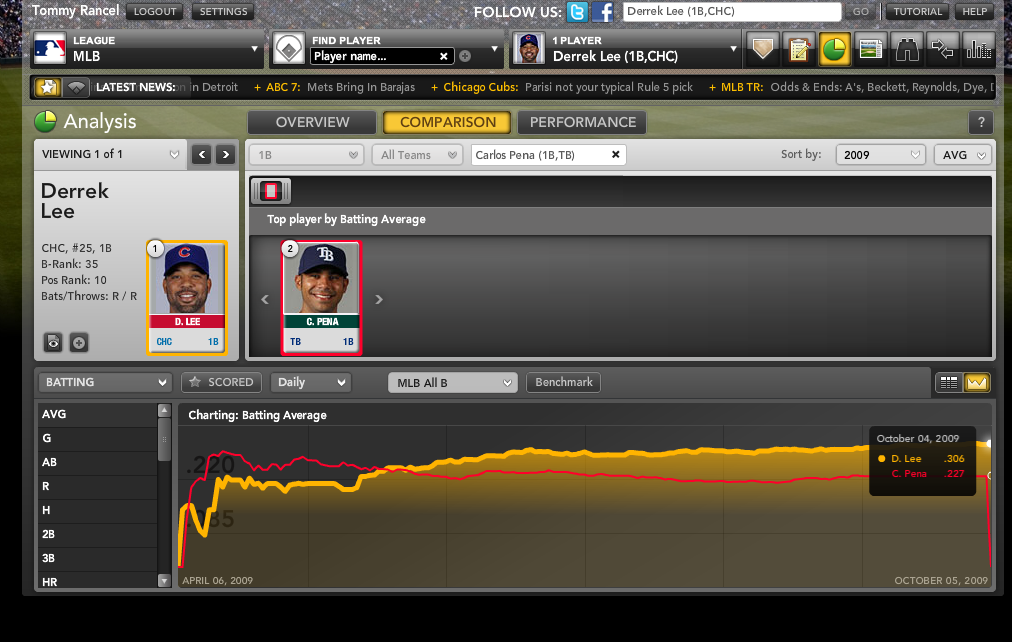
The dot nearly on top of Lee’s belongs to Carlos Pena. Pena’s value is nearly as high as Lee’s. If you can get either one you’ll be the benefactor of a big bargain. The reason to chose Lee over Pena is batting average. Looking at the trend line chart below, you can see just how big of a gap there is between the two in that category.
Outside of Lee and Pena, other four-star first basemen include: Justin Morneau, Votto, Berkman, Adam Dunn and Kendry Morales. None of the names above come close to representing the value of Lee. Here’s a look at each player’s B-Rank and ADP
Morneau
B-Rank: 42
ADP: 37.2
Votto
B-Rank: 34
ADP: 39.3
Berkman
B-Rank: 60
ADP: 69.0
Dunn
B-Rank: 38.0
ADP: 58.0
Morales
B-Rank 43
ADP: 59.5
Only Votto (34th) has a B-Rank higher than Lee (35th); however, all five of these 1B are being drafted three to five rounds earlier. It’s hard to fight the temptation of drafting Morneau or Votto in the fourth round, but your team is likely better off pursuing an elite starting pitcher or help at a shallower position, the coming back around to add Lee two or three rounds (or more) later.
Because he’s in a contract year, Lee is a safer play in a mixed league than an NL-only. If the Cubs fall out of the race by July 31, contenders in both leagues could be battling for his underrated services. Don’t find yourself in a similar fight come draft day. Lock him down.
For more information on Derek Lee and hundreds of other players check out Bloomberg Sports’ fantasy kits for yourself.
Cole Hamels and the Verducci Effect
By Tommy Rancel
Sports Illustrated writer and MLBNetwork contributor Tom Verducci recently released his annual list of red-flagged pitchers for the 2010 season. The list is comprised of pitchers under the age of 25 who saw increases of 30 innings or more from 2008 to 2009. The so-called “Verducci Effect” holds that such pitchers are at greater risk of injury or weaker performance the year after their big innings jump.
The theory has been questioned in numerous places. I’ll leave the broader criticism to others. For now, I’m more interested in one particular pitcher: Cole Hamels.
Before the 2009 season, Hamels appeared on Verducci’s list. Going by superficial stats, Verducci appeared to have nailed his prediction on the Phillies left-hander. Hamels followed up his very good 2008 season (14-10, 3.09 ERA at age 24), by going just 10-11 with a 4.32 ERA in 2009 at age 25.
Hamels looked like a classic case of the Verducci Effect. But was he really?
One of my favorite statistics to use when evaluating pitchers is Fielding Independent Pitching, or FIP. The method created by Tom Tango measures on-field events pitchers can control, independent of defense: strikeouts, walks, and home runs.
Despite the big ERA from 2008 to 2009, Hamels saw a slight increase in his strikeout rate, from 7.76 to 7.81 per 9 innings, and a decrease in his walk rate, from 2.1 to 2.0 per 9 IP. His HR/9 IP rate ticked up just slightly, from 1.11 to 1.12. Hamels’ fielding independent stats tell the story:
Hamels 2008 FIP: 3.72
Hamels 2009 FIP: 3.72
These statistics suggest that factors outside Hamels’ control led to the downturn in his fantasy stats. One of the biggest factors working against him was a higher batting average on balls in play (BABIP).
In 2008, Hamels yielded a .270 BABIP, a figure that ranked substantially below league average, and suggested good luck, good defense or both helping Hamels. That number jumped to .325 in 2009, a figure well above average that likely suggested bad luck, given that the Phillies didn’t make many changes to their defensive alignment.
Hamels career BABIP now sits at .295. The smart money then, all other factors being equal, is on his 2010 ERA finishing above his 3.09 mark in 2008 and below the 4.32 finish in 2009. Hamels’ career ERA of 3.67 sets a reachable goal.
Take a look at Hamels’ profile using Bloomberg’s Spider Chart (bottom center). You’ll note that he measures well in every category except ERA and Wins, both categories that could be much improved in 2010 with better luck.

As for the attitude and mental side of the game, reports out of Philadelphia say Hamels is in a much better frame of mind headed into this season. As for Hamels’ innings count, the Phillies might ask a little less of their young lefty, with new teammate Roy Halladay on board for an entire season to serve as the kind of workhorse that Cliff Lee was for Philly after last summer’s trade.
When putting together your 2010 rotation, be sure you use Hamels’ poor 2009 campaign to your advantage. Feel free to cite last season’s rise in ERA and his sub .500 win percentage to your fellow league members. Remind them that Johan Santana is coming back and has declared himself the best pitcher in the National League East.
Santana’s average draft position (ADP) is 39.5. This means in most 10- or 12-team leagues he is off the board by the end of round four. Hamels’ ADP, meanwhile, is 86.2, putting him in the eighth or ninth round in a 10-team league. Despite the four-round difference in ADP, the two left-handers are separated by just 11 spots in B-Rank. Only four starting pitchers fall in between the pair.

This is not a knock on Santana, but more an indication of how you can steal Hamels in the mid-rounds as your SP2, or even SP3, while others shy away due to last year’s ERA jump and mediocre won-lost record. Use the Verducci Effect to your advantage, and you could snag a bargain.
For more information on Cole Hamels and hundreds of other players, and for dozens of tools to help you dominate your fantasy league check out Bloomberg Sports’ fantasy kits.
Need Another Outfielder? Choose Choo
By Tyler McKee
Many of the seats at The Jake – ahem, excuse me – “Progressive
Field'” are likely to sit empty this summer, as the Cleveland Indians
figure to muddle through another losing season.
The Tribe’s roster similarly contains some underexposed players. Shin-Soo Choo
continued to quietly emerge as one of the American League’s most
productive outfielders last season, easily outdistancing more heralded (and more desired)
players, such as teammate Grady Sizemore – despite Sizemore missing 56
games and putting up much weaker numbers than Choo in 2009.
Choo put himself in an elite class last season, becoming one of just
14 players to reach 20 home runs and 20 stolen bases. Choo is an elite outfield option with
an elite reputation, with few offensive holes in his game and
across-the-board contributions in 5X5 fantasy leagues – as shown in
this Bloomberg Sports Spider Chart.
The
chart shows Choo rating above league average in all five offensive
categories: 20 homers, 21 steals, 86 RBI, 87 runs scored, and a .300
batting average. Advanced metrics, which account for walks and other
non-fantasy contributions, show Choo with 116 Runs Created in 2009.
That total places him behind only one other MLB outfielder: Brewers hitting Ryan Braun.
Choo’s a safe
bet to play against any pitcher, given his reasonable splits. In 2009, he hit a stellar .312/.406/.504 (AVG/OBP/SLG) against right-handed pitching, and a still solid .275/.369/.456 vs. lefties.
Choo
does have one glaring weakness: he strikes out a lot – he whiffed 151 times last season. Few players can rack up strikeout totals that high and
still maintain a .300 average. A sky-high
.370 batting average on balls in play (BABIP) helped Choo pull off the feat last year; expect some BABIP
regression in 2010, and with it some downside batting average risk.
Even
with a potential batting average pullback, Choo’s all-around skills make him a great selection. It’s Choo’s potential value play that makes him most attractive, though. The 27-year-old right fielder is getting picked in the middle
rounds of drafts, with an Average Draft Position of 76. Compare
that number to Choo’s B-Rank: Bloomberg Sports’ proprietary overall
ranking slots him as #27 overall, eighth among OF. That 49-slot gap is
one of the largest for any player in our database.
Target Choo around the late-fifth or early-sixth round
in a 12-team mixed league. If you land him near that spot, you’ll have a big,
screaming bargain.
For more information on Shin-Soo Choo and hundreds of other
players, and for dozens of tools to help you dominate your fantasy
league, check out Bloomberg
Sports’ fantasy kits.
Welcome to the Bloomberg Sports Blog
Welcome to the debut of the Bloomberg Sports blog, a partner of Major
League Baseball and part of the MLBlogs network. Starting today and
continuing through the final pitch of the World Series, we’ll cover all
the hot topics in baseball and fantasy baseball, with the help of Bloomberg Sports’ proprietary software and analytics.
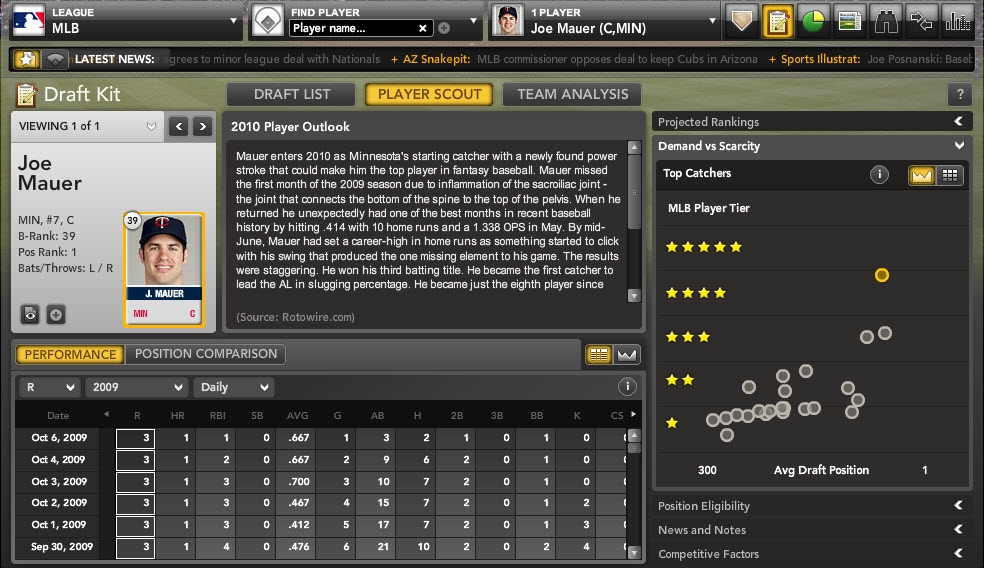
Say you’re preparing for your fantasy draft, targeting Joe Mauer as
your starting catcher. Bloomberg Sports’ Draft Kit includes rankings
for every player, called B-Rank. Using B-Rank, you’ll see how Mauer
stacks up against all other players.
You can then delve deeper. Say you want to eyeball a player’s value against others at the
same position, then make an informed decision on when in the draft to
grab him. Bloomberg Sports’ Scarcity vs. Demand graph shows you a graph
of the top 10 players at that position, how high each one should be
drafted, and where the best values might lie. If you’re scouting Mauer,
the yellow dot representing the Twins catcher will show up far above
all other catchers, a sign of his unique value.
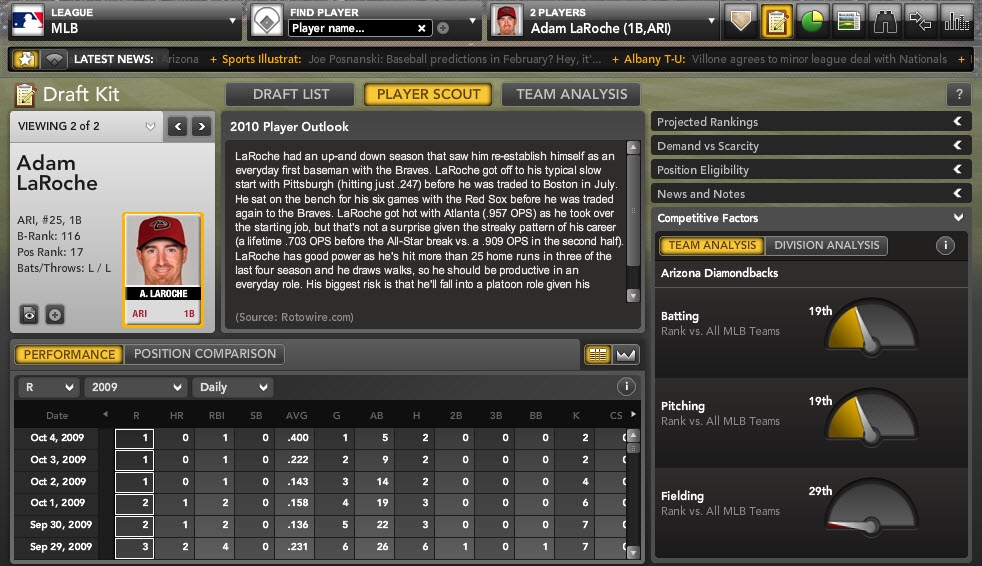
Now let’s explore a player whose ranking isn’t as obvious, newly signed Arizona Diamondbacks first baseman Adam LaRoche.
According to B-Rank, LaRoche rates 17th among all major league first basemen for projected 2010 fantasy value, given standard 5×5 criteria. In a 12-team National League-only league or deep mixed league, LaRoche would be worthy of a starting job. He would project as a mid-to-late round pick, in a cluster with decent but unspectacular players like the Dodgers’ James Loney in the Scarcity vs. Demand graph.
Using our Spider Chart, you can see that LaRoche derives most of his value from counting stats such as home runs, runs scored and RBI, with less value derived from his batting average and virtually none from stolen bases. At a glance, you can spot LaRoche’s 2009 totals in every category against other players major league-wide, or just other first basemen. His 25 home runs, for instance, placed just below the average of 27 homers for qualifying MLB starters at first base, well below the MLB-leading total of 47 at that position.
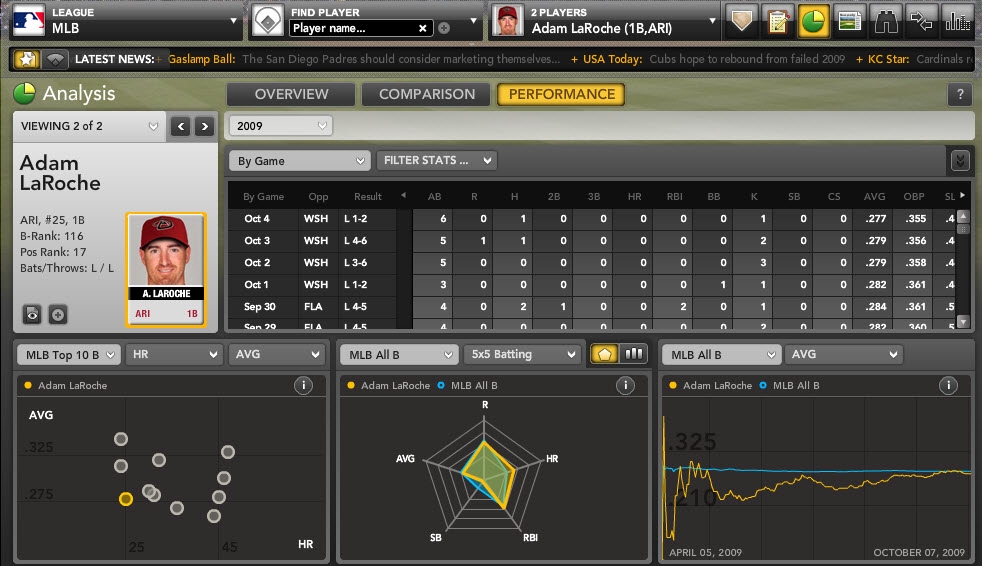
Using the Scatterplot tool, you can
compare LaRoche’s value across two categories at once, measured against the top 10 players
in that two-category combination — home runs and batting average, RBI and stolen bases, and other customizable combinations.
The Bloomberg Sports team of writers will then dig up more nuggets of information for your perusal. Say you’re satisfied with LaRoche as a low-end starter for your team. But you’re concerned about his large splits – for his career, LaRoche has batted .252/.326/.447 (AVG/OBP/SLG) in the first half, with a much stronger .300/.363/.546 line in the second half. You might then view LaRoche as someone to target in trade around the All-Star break, rather than spending a pick on him in your draft or auction.
Ascertaining why a player fares better in one half of the season compared to the other can be a tough task. Often it’s the equivalent of flipping a coin and landing on heads five times in a row: a rare but possible occurrence that’s based simply on random chance.
Occasionally there might be other reasons. Some players perform better in warmer weather, or at least hit for more power in warmer weather. In Pittsburgh and even Atlanta, where he played the bulk of his first six major league seasons, LaRoche’s power indicators jumped across the board as temperatures rose. For his career, he’s hit home runs on 12.7% of his flyballs in March and April, 11.7% in May and 12.8% in June. That number soars to 18.9% in July and 17.0% in August, making LaRoche a greater power threat in the warmer summer months. In sweltering Phoenix, LaRoche can expect average highs of 84 in April and 93 in May. By June, the Diamondbacks will likely close their retractable roof for most games, with average temperatures near or over 100 for the final four months of the season. The closed roof would in turn create cooler home playing conditions as the season wore on.
We can’t say for certain if LaRoche’s superior performance and higher power output in the second half is the result of warmer weather – it could simply be another way to look at the same random streak of better second-half performances. If it is weather-related, though, playing in Arizona, and facing warmer-weather opponents more often in the NL West, could portend a hotter-than-usual start for LaRoche.
LaRoche could also get a boost from more favorable ballpark effects. Chase Field consistently ranks as one of the most favorable stadiums in baseball for hitters – second behind Coors Field in run factor last season and second behind Rangers Ballpark in Arlington. Chase’s configuration also plays to one of LaRoche’s greatest strengths as a hitter. LaRoche has averaged 37.5 doubles per year in the past four seasons, ranking him among the league leaders in that category. Only Fenway Park, with its shallow, towering Green Monster, has yielded a higher doubles effect in the past two seasons than Chase Field.
Once the season starts, Bloomberg Sports’ In-Season tools let you
track a player’s day-today performance down to the finest details. Say
you drafted LaRoche and he got off to another slow start, hotter weather and all. The Visual Benchmark
tool lets you plot how LaRoche’s three home runs through the first 40
games of the season compare to different cohorts: other players at his
position, other National League players at his position, or the league
average for all players.
Still not sure if you should hold or cut bait? Using the
Competitive Factors tool, you can see how LaRoche’s new team stacks up
against the rest of the league. Last year, the Diamondbacks ranked 19th in batting average (20th in MLB in runs scored), despite their hitter-friendly home park. If Chris Young, Stephen Drew and other talented but erratic teammates don’t fare better in 2010, that suppresses LaRoche’s potential to score
and drive in runs – meaning you might want to consider a different option at first base.
This blog will help you leverage these and many other tools, by pairing Bloomberg
Sports analysis with the latest MLB happenings. Joining myself and
Bloomberg Sports’ Tyler McKee are the following writers:
R.J. Anderson:
His work has appeared in Baseball America, USA Today, ESPN.com, The Hardball
Times, FanGraphs, The Graphical Player, and RotoJunkie’s Annual
Baseball Draft Guide, The Fix.
Erik Hahmann: His baseball and fantasy baseball writing has appeared at Heater Magazine, DRaysBay and Beyond The Boxscore.
Tommy Rancel: He’s written for a number of publications, including Beyond The Boxscore, Inside the Majors and The Hardball Times.
Eno Sarris: He’s covered baseball and fantasy baseball for FanGraphs, Yahoo Fantasy
Baseball, RotoExperts and GodBlessBuckner on the Fanball network. He
won a Fantasy Sports Writers’ Association Award for his work at Fantasy
Lounge Sports.
Pitchers and catchers are reporting throughout the Grapefruit and
Cactus Leagues and we couldn’t be more excited to start the season.
Bookmark bloombergsports.mlblogs.com for the latest news and analysis. You’ll also find us as a Featured blog at MLBlogs.com, as well in the MLBlogs.com Pro Blogs pull-down menu, under Fantasy.
Also, follow us on Twitter @BloombergSports and Facebook.
Then, be sure to check out Bloomberg Sports’ Draft Kit and In-Season Tools.
Play Ball!
–Jonah Keri
