Tagged: Rotation
C.J. Wilson’s Potential Move To The Rangers’ Rotation
By Tommy Rancel
Spring Training marks a period of experimentation. With a month of meaningless games to fill, it’s the perfect time to try things that you would never think of once Opening Day arrives. Most experiments go nowhere and end in mid-March. Occasionally one will work, such as last season’s move of Skip Schumaker from the outfield to second base for the St. Louis Cardinals.
The Texas Rangers are doing some experimentation of their own by giving set-up man and former closer C.J. Wilson a chance to compete for a rotation spot. In recent seasons we’ve seen Adam Wainwright, Ryan Dempster, and Braden Looper make successful moves from reliever to starter – albeit to differing degrees.
It was not too long ago when Wilson was the Rangers’ closer. After solid numbers in 2007 (66 games, 3.02 ERA, 12 saves), Rangers Manager Ron Washington tapped the lefty as the team’s bullpen stopper in 2008. However, things didn’t go according to plan. In 2008, Wilson saved 24 games, but finished with a dismal 6.02 ERA in 50 games.
The biggest difference between the two seasons was a disparity in home runs. After allowing just four homers in 68.1 innings in 2007, Wilson gave up eight in just 46.1 innings in 2008.
The huge jump can be explained by a ridiculously high home run-to-fly ball rate (HR/FB). For his career, Wilson owns a HR/FB rate of 12.6%. But in 2008, his HR/FB skyrocketed to 16.8%, up from 2007 levels, when batters hit home runs on 8.2% of the flyballs hit off Wilson.
Wilson benefited from regression last year, when his HR/FB dropped to a career-low 6.3%, in the process lowered his home runs allowed per nine innings rate (HR/9) to 0.37 – also a career best. Filling the set-up role and backup closer role in support of the Rangers’ top closer choice Frank Francisco, Wilson finished the season with 14 saves and set career marks in several categories, including: wins (5), games pitched (74), innings pitched (73.2), strikeouts per nine innings (K/9) (10.26), and ERA (2.81).
Despite the career year out of the bullpen, Wilson is still auditioning for a rotation spot in the Texas Rangers rotation. Why? Because in most cases 150 innings of average starting pitching is more valuable to a team than a 60 good middle relief innings.
As strong as Wilson’s 2009 campaign was, his contributions added up to a decent but not overwhelming 2 wins above replacement level (WAR represents the number of wins a player adds to his team over your typical 25th man on a roster). According to fangraphs.com, Wilson was one of just one of 10 relievers to hit the 2 WAR threshold, showing the limited upside inherent in a role that severely limits innings pitched. On the other hand, 63 starting pitchers were worth 2 WAR or more.
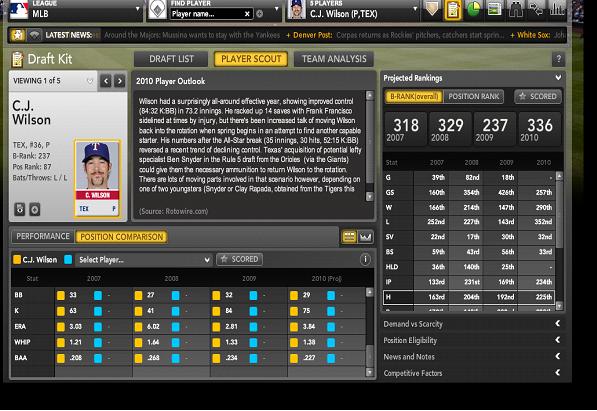
According to B-Rank (Bloomberg’s proprietary ranking of all players), Wilson’s stellar relief numbers earn him an overall ranking of 336. In most leagues he is not even drafted. On the other hand, Joe Saunders ranks 271th despite posting a nearly league average 4.60 ERA and an ugly 5.17 FIP (Fielding Independent Pitching, a stat that runs along a similar scale to ERA, while stripping out factors a pitcher can’t control such as defense and luck). He is also drafted in almost every league regardless for format. This is just another example of the value of league average starting pitching over above average relief
The move from bullpen to rotation is a tricky one. It’s generally accepted that a pitcher can see increases in ERA, strikeouts and velocity moving from the rotation to the bullpen. New Yankee Chan Ho Park is a good example of his phenomenon. As a starter, Park owns a career 4.39 ERA. His ERA plunged to 2.58 last season, on the strength of a strikeout rate that reached its highest point for a full season since 2001. Park also saw an increase in velocity: He posted an average fastball velocity of 92.2 MPH last season, up from his career average of 90.3 MPH. Even if Wilson makes a successful transition, he will likely see the reverse effect that Park – and other failed starts like Eric Gagne and Jose Mesa – experienced in moving to the bullpen from the rotation. In 2009, only two qualified major league starters posted K/9’s above 10.00: two-time National League Cy Young winner Tim Lincecum (10.42) and Justin Verlander (10.09).
In addition to the strikeouts, there are also the looming home run concerns. As mentioned, Wilson enjoyed career best marks of 6.3% HR/FB and 0.37 HR/9 in 2009. Beyond regression to the mean, neither are sustainable as a starting pitcher. In 2009, only five starters had HR/9 less than 0.50: Chris Carpenter (0.33), Clayton Kershaw (0.37), the aforementioned Lincecum (0.41), AL Cy Young Winner Zack Greinke (0.43) and Joel Pinero (0.46). Looking at HR/FB rates, five starters had rates below 6.0%, including four names from above: Carpenter (4.6%), Kershaw (4.1%), Lincecum (5.5%) and Greinke(4.5%), along with Carlos Zambrano (5.6%).
Outside of the statistical regressions, the biggest question is can Wilson handle the toll of pitching every fifth day over a 162-game season? After spending nearly five seasons in the bullpen, Wilson will be asked to throw at least 150 innings and upwards of 100 pitches per start. Last season, he threw 25 or
more pitches 14 times and never went over 38 pitches in one appearance. The good news is Wilson’s numbers reflect that he does better when pitching on more days rest. With zero days rest in between appearances, Wilson’s slash line against was .325/.385/.482 (opponents’ AVG/OBP/SLG) last year. When working on three days rest that went down to .190/.261/.238; on four days it was .190/.190/.238 on four days. (Please note small sample sizes in all cases.)
In addition to the physical aspect of starting, Wilson will need to work on pitch selection. A relief pitcher can get by with one dominant pitch and a secondary pitch. A starting pitcher generally needs at least three pitches to deal with the opposing lineup three or four times a night. Wilson has an above average fastball and a decent slider, but is lacking a true third option. In 2009, he toyed with a cut fastball and a curveball, but neither was used more than 5.6% of the time. He will need to up the usage of both pitches, or concentrate on just one as his third pitch, to balance out his pitch selection.
When taking everything into account – statistical regressions, the physical impact and pitch selection – Wilson is facing an uphill battle. But it’s a battle worth fighting. Despite being one of the games better relievers last season, Wilson was not a valuable fantasy player, because pitchers can only produce so much value (in fantasy or real life) as non-closing relief pitchers. However, if Wilson can parlay his solid historical strikeout rates into a league-average ERA as a starter, his value would jump considerably. I wouldn’t put Wilson on any draft boards as a starter right now; but you should add him to your watch list.
To keep an eye on C.J. Wilson, and hundreds of other players, check out Bloomberg Sports’ fantasy kits
Cole Hamels and the Verducci Effect
By Tommy Rancel
Sports Illustrated writer and MLBNetwork contributor Tom Verducci recently released his annual list of red-flagged pitchers for the 2010 season. The list is comprised of pitchers under the age of 25 who saw increases of 30 innings or more from 2008 to 2009. The so-called “Verducci Effect” holds that such pitchers are at greater risk of injury or weaker performance the year after their big innings jump.
The theory has been questioned in numerous places. I’ll leave the broader criticism to others. For now, I’m more interested in one particular pitcher: Cole Hamels.
Before the 2009 season, Hamels appeared on Verducci’s list. Going by superficial stats, Verducci appeared to have nailed his prediction on the Phillies left-hander. Hamels followed up his very good 2008 season (14-10, 3.09 ERA at age 24), by going just 10-11 with a 4.32 ERA in 2009 at age 25.
Hamels looked like a classic case of the Verducci Effect. But was he really?
One of my favorite statistics to use when evaluating pitchers is Fielding Independent Pitching, or FIP. The method created by Tom Tango measures on-field events pitchers can control, independent of defense: strikeouts, walks, and home runs.
Despite the big ERA from 2008 to 2009, Hamels saw a slight increase in his strikeout rate, from 7.76 to 7.81 per 9 innings, and a decrease in his walk rate, from 2.1 to 2.0 per 9 IP. His HR/9 IP rate ticked up just slightly, from 1.11 to 1.12. Hamels’ fielding independent stats tell the story:
Hamels 2008 FIP: 3.72
Hamels 2009 FIP: 3.72
These statistics suggest that factors outside Hamels’ control led to the downturn in his fantasy stats. One of the biggest factors working against him was a higher batting average on balls in play (BABIP).
In 2008, Hamels yielded a .270 BABIP, a figure that ranked substantially below league average, and suggested good luck, good defense or both helping Hamels. That number jumped to .325 in 2009, a figure well above average that likely suggested bad luck, given that the Phillies didn’t make many changes to their defensive alignment.
Hamels career BABIP now sits at .295. The smart money then, all other factors being equal, is on his 2010 ERA finishing above his 3.09 mark in 2008 and below the 4.32 finish in 2009. Hamels’ career ERA of 3.67 sets a reachable goal.
Take a look at Hamels’ profile using Bloomberg’s Spider Chart (bottom center). You’ll note that he measures well in every category except ERA and Wins, both categories that could be much improved in 2010 with better luck.

As for the attitude and mental side of the game, reports out of Philadelphia say Hamels is in a much better frame of mind headed into this season. As for Hamels’ innings count, the Phillies might ask a little less of their young lefty, with new teammate Roy Halladay on board for an entire season to serve as the kind of workhorse that Cliff Lee was for Philly after last summer’s trade.
When putting together your 2010 rotation, be sure you use Hamels’ poor 2009 campaign to your advantage. Feel free to cite last season’s rise in ERA and his sub .500 win percentage to your fellow league members. Remind them that Johan Santana is coming back and has declared himself the best pitcher in the National League East.
Santana’s average draft position (ADP) is 39.5. This means in most 10- or 12-team leagues he is off the board by the end of round four. Hamels’ ADP, meanwhile, is 86.2, putting him in the eighth or ninth round in a 10-team league. Despite the four-round difference in ADP, the two left-handers are separated by just 11 spots in B-Rank. Only four starting pitchers fall in between the pair.

This is not a knock on Santana, but more an indication of how you can steal Hamels in the mid-rounds as your SP2, or even SP3, while others shy away due to last year’s ERA jump and mediocre won-lost record. Use the Verducci Effect to your advantage, and you could snag a bargain.
For more information on Cole Hamels and hundreds of other players, and for dozens of tools to help you dominate your fantasy league check out Bloomberg Sports’ fantasy kits.
