Tagged: b-rank
Casey Blake: Boring but Effective Fantasy Option
By R.J. Anderson
Casey Blake will enter this season as the Los Angeles Dodgers’ starting third baseman for the second consecutive season. Blake, 36, qualifies as a solid if unspectacular player. Last season he hit .280, popped 18 homers, drove in 79 runs a season, scored 84 runs and stole all of three bases. He’s an above-average hitter, no doubt, but is he worth a roster spot in a 12-team mixed league?

Such a question would be so much easier if the Dodgers used Blake like the Cleveland Indians did for years. Last season, Blake appeared in 134 games at third and two at first and left. The year before he appeared in enough games to become eligible at third base and first base, and in the past he’s been eligible at three positions at once. But if a Manny Ramirez suspension wasn’t enough to get Blake out in the pasture, then the addition of Jamey Carroll and Garret Anderson almost certainly won’t lure Blake to another position.

That means Blake’s numbers matter only relative to other third basemen in the league. Bloomberg ranks him as the 13th-best third baseman, and one going well below his B-Rank slot of 152. Instead, Blake is being drafted, on average, at 282nd. That’s a gap of more than 100 slots, indicating that Blake is being undervalued. He’s projected to nearly match last year’s numbers, with 19 homers, a .276 average, and 79 RBI.
That makes Blake a more attractive option than other hot corner bearers like Jorge Cantu, Mark DeRosa, Alex Gordon (destined to start the season on the disabled list), Scott Rolen, and Miguel Tejada.
Is Blake worth a roster spot? He’s not a sexy option, but yes, he’s worth drafting in 12-team mixed leagues. Target him in the late rounds, and take advantage of the huge gap between his likely value and his perceived value.
For more
information on other good third base options, check out Bloomberg Sports’ fantasy kit.
The Pavano Principle
By R.J. Anderson
Carl Pavano has long been a whipping boy, an entry into a word association game when the term “fragile” came up, and a baseball punchline. Pavano thrived in relative anonymity last season, posting a good enough year with the terrible Cleveland Indians to earn him a trade to the contending Minnesota Twins. Rather than testing the frost-bitten market, Pavano accepted the Twins’ offer of arbitration. And boy, who can blame him? The Twins added some fun toys for his usage in the form of a new middle infield with high defensive reputations and offensive ability.
Nothing about Pavano screams fantasy asset. He’s a pitchability type, someone who relies on getting groundballs and avoiding mistakes. His injury-heavy past makes him more of a risk than most and he’s always given up quite a few homers. Pour all of that information into a bowl and whisk softly for a few minutes until the aroma of sleeper hits you. Right? Well, evidently not, since Pavano is being drafted at an average spot of 188th. His B-Rank is a low 324th and his positional rank (meaning of all pitchers, not just starters) is 118th.
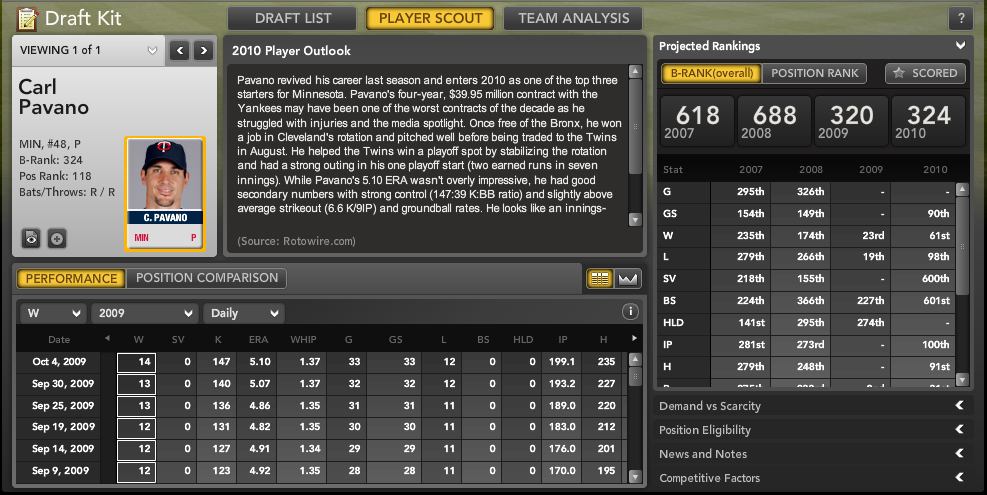
Pavano is pitching for the AL Central favorites, so wins should be available. The defense behind him is strong, so his ERA could be playable. He doesn’t strike many out, but then again he doesn’t walk many either, so his K/BB and WHIP are passable. But, is he really worth a top-200 pick? The immediate options that surround Pavano in the B-Rank standings are young talents like Bud Norris, Brian Matusz, and Derek Holland – three pitchers with considerably more upside who aren’t being drafted until the 250-270 range, if it all (in Norris’ case, he’s not being drafted).
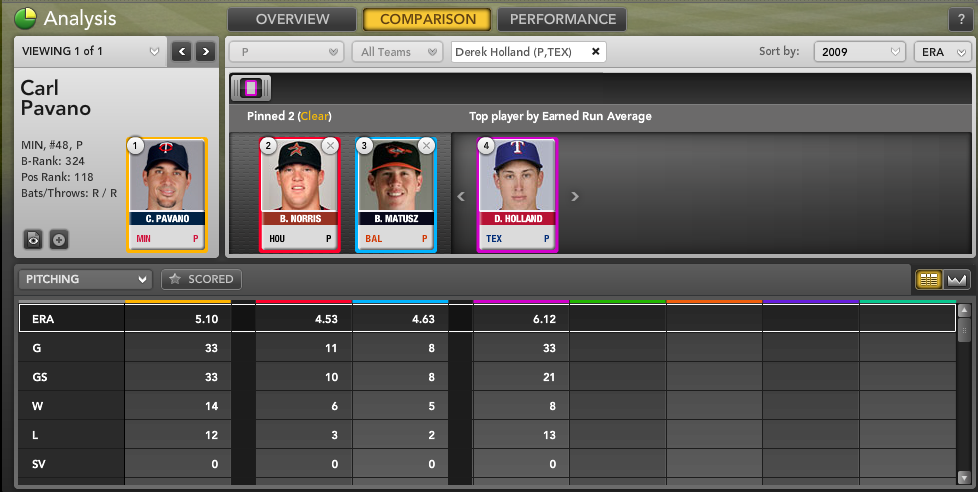
It’s not that Pavano is worthless or unworthy of being considered a fantasy option. It’s just that he’s being favored in front of options with a lot more potential to help your team. In shallower leagues, there’s no reason at all to take Pavano ahead of these younger pitchers: You can always find another generic SP with a 4.50 ERA and 12 wins on the waiver wire in a 10- or 12-team mixed league. But Holland and Matusz have the potential to be top-tier pitchers if or when their breakout comes.
At the end of your draft, take the upside pick, not predictable mediocrity.
For more information on possible over- and underrated starting pitchers and more, check out Bloomberg Sports’ fantasy kits.
The Underrated Derek Lee in 2010
By Tommy Rancel
At a position stacked with superstar names, Chicago Cubs first baseman Derrek Lee is often overlooked. The best player on the face of the planet, Albert Pujols, plays the same position in the same division. So do sweet-swinging first basemen Prince Fielder, Lance Berkman, and Joey Votto.
That Lee gets lost in the shuffle among other big hitters only makes him a more attractive pick. In 2009, he hit .306/.393/.579 (AVG/OBP/SLG) with 35 home runs, 111 RBI and 91 runs scored. His .972 OPS was fourth-best in the National League. The three names in front of him were all familiar foes: Pujols, Fielder and Votto.
Looking at Lee’s Spider Chart (bottom center), you can see the extent of his all-around contributions.
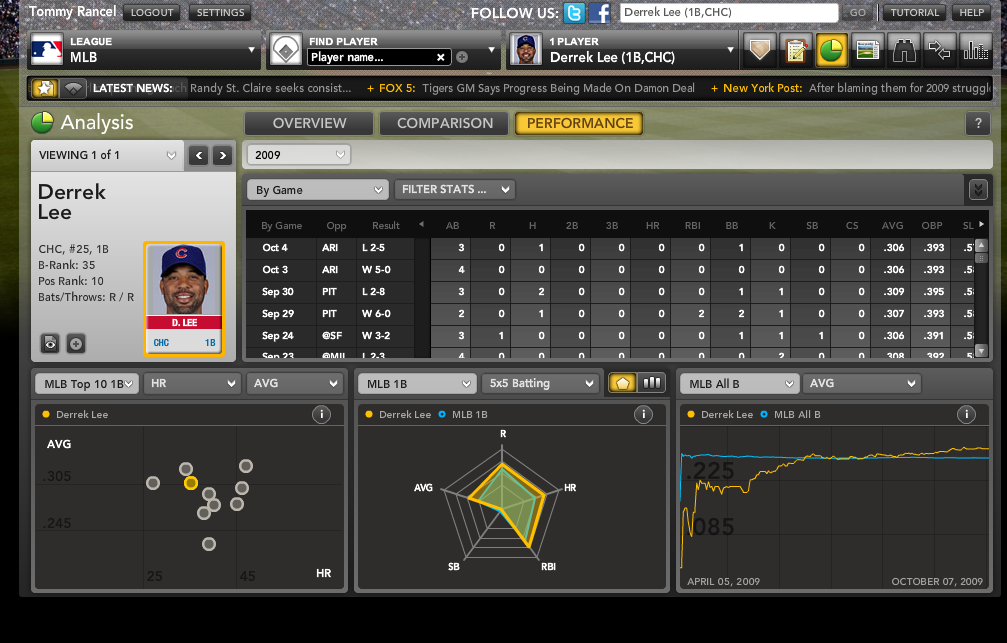
The biggest question facing Lee in 2010 is, can these numbers be sustained? It’s hard to envision a 34-year-old player duplicating such a great season.
When we look for flukes in a batter’s season, we often look at batting average on balls in p
lay (BABIP) and home run-to-fly ball ratios (HR/FB). In 2009, Lee had a BABIP of .327, well above league average, which typically hovers near .300. Lee’s career BABIP sits at .323, though, suggesting his ’09 figure isn’t unusual.
Lee’s career home run-to-flyball rate spiked to 17.9% in 2009, up from 11.7% In 2008. On the plus side, that ’08 figure represented a career low; Lee’s career HR/FB rate is 17%
With regression questions answered, we can look forward to the 2010 season. The most conservative projection on Lee in 2010 comes from the CHONE projection system. CHONE projects a slash line of .285/.365/.487. That would give him an OPS decline of .120 points compared to ’09 levels. Bloomberg Sports pegs Lee to hit .303/.386/.526. .
At these levels, Lee figures to slot in below some of the elite first basemen on baseball. But we’re still bullish on him, especially in 12-team mixed and deeper leagues. Here’s why.
Lee ranks 35th overall in B-Rank (Bloomberg’s proprietary ranking of all players). Despite the relatively high overall ranking, he is the 10th-rated first basemen. This is more a testament to the talent level at the position than Lee’s abilities. With such a deep pool of talent, it is essential to get a bargain at the position. Unless you’re able to score Pujols, Fielder, Ryan Howard or Mark Teixiera in the first round, you might want to lie in the weeds and snatch up Lee much later.
Average Draft Position shows Lee being taken at #90, making a 55-spot gap between where Bloomberg Sports ranks him and where people are drafting him. Looking at the Demand vs. Scarcity chart below, you’ll see that there are plenty of good first basemen available. But few have a bigger gap between their B-Rank and ADP than Lee.
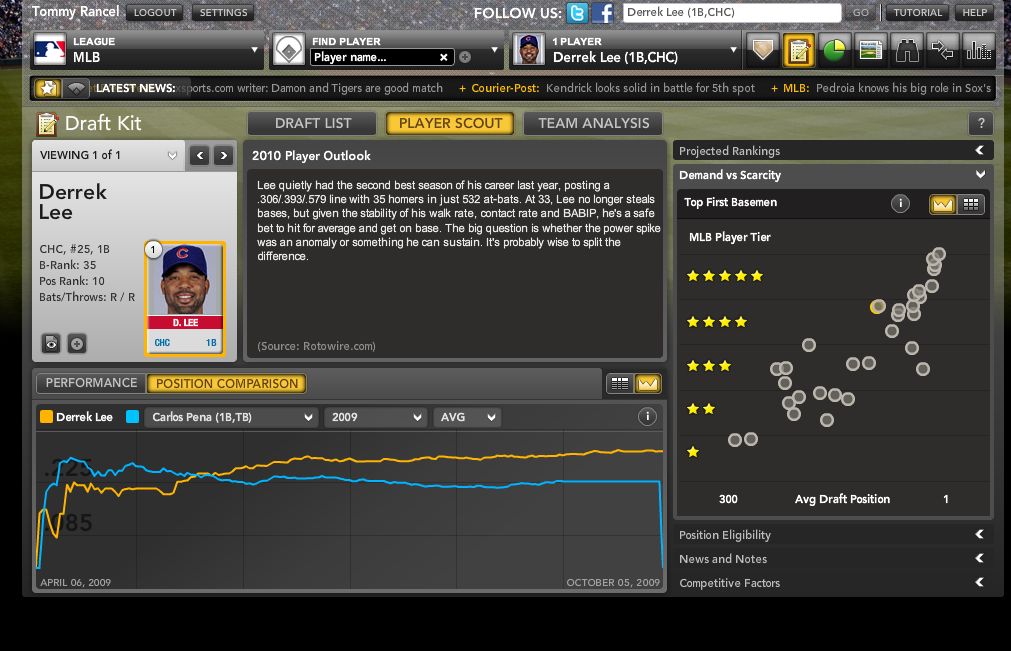
The dot nearly on top of Lee’s belongs to Carlos Pena. Pena’s value is nearly as high as Lee’s. If you can get either one you’ll be the benefactor of a big bargain. The reason to chose Lee over Pena is batting average. Looking at the trend line chart below, you can see just how big of a gap there is between the two in that category.
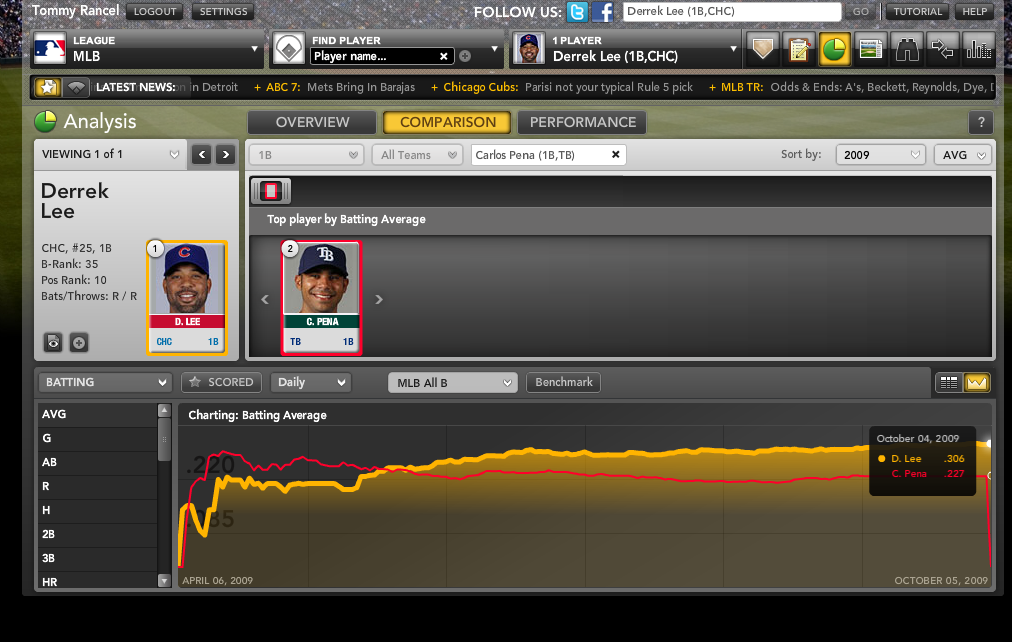
Outside of Lee and Pena, other four-star first basemen include: Justin Morneau, Votto, Berkman, Adam Dunn and Kendry Morales. None of the names above come close to representing the value of Lee. Here’s a look at each player’s B-Rank and ADP
Morneau
B-Rank: 42
ADP: 37.2
Votto
B-Rank: 34
ADP: 39.3
Berkman
B-Rank: 60
ADP: 69.0
Dunn
B-Rank: 38.0
ADP: 58.0
Morales
B-Rank 43
ADP: 59.5
Only Votto (34th) has a B-Rank higher than Lee (35th); however, all five of these 1B are being drafted three to five rounds earlier. It’s hard to fight the temptation of drafting Morneau or Votto in the fourth round, but your team is likely better off pursuing an elite starting pitcher or help at a shallower position, the coming back around to add Lee two or three rounds (or more) later.
Because he’s in a contract year, Lee is a safer play in a mixed league than an NL-only. If the Cubs fall out of the race by July 31, contenders in both leagues could be battling for his underrated services. Don’t find yourself in a similar fight come draft day. Lock him down.
For more information on Derek Lee and hundreds of other players check out Bloomberg Sports’ fantasy kits for yourself.
Draft Lots of Yankees and Phillies
By R.J. Anderson
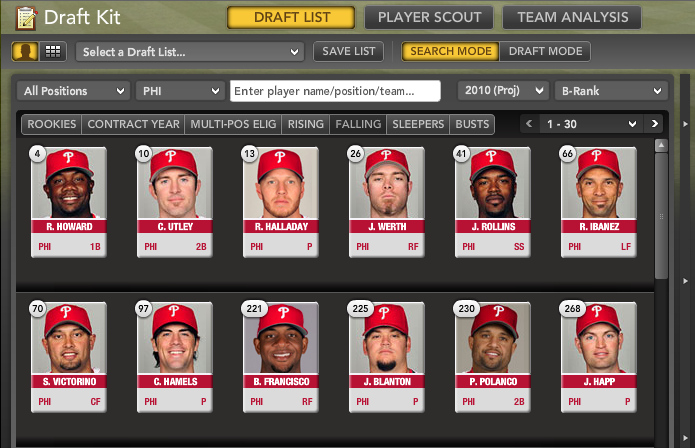
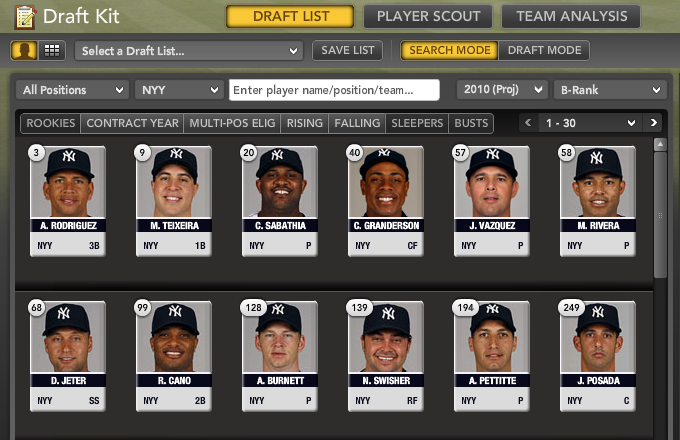
The last time we saw competitive major league baseball, the New York Yankees and Philadelphia Phillies played in the World Series. Fittingly, those two teams are battling for something in the spring. This time it’s purely about bragging rights, and purely about the number of players in the top 100 B-Rank. The Yankees and Phillies both feature eight players apiece; the Red Sox hold seven; the Dodgers six; the Twins, Rays, Astros, and Cardinals with five; and five teams only have one player making the cut, including the Royals, Pirates, and Padres.
Number of players ranked within the top 100:
8 – NYY, PHI
7 – BOS
6 – LAD
5 – MIN, TB, HOU, STL
4 – SEA, FLA
3 – BAL, LAA, TEX, ARI, ATL, MIL, NYM, SF
2 – CLE, DET, TOR, CHC, CIN, COL, WAS
1- CWS, KC, OAK, PIT, SD
Number of hitters ranked within the top 100:
6 – PHI
5 – NYY, TB
4 – BOS, MIN, HOU
3 – LAD, STL, BAL, LAA, TEX
2 – SEA, FLA, ARI, ATL, MIL, NYM, CLE, TOR, CHC, CIN, COL, WAS
1 – SF, DET, CWS, PIT, SD
0 – KC, OAK
Some time later in your draft, a decision will have to be made between two players of similar caliber. The difference very well could be the quality of the lineup surrounding said players. That’s where the following data should help. If the decision comes down to Marco Scutaro (B-Rank of 213) or Everth Cabrera (190), then a quick scan of the differences between Boston’s quality of hitters and San Diego’s can pay dividends. Especially since so many leagues rely heavily on stats like RBI and R, two numbers that favor players in strong lineups over those surrounded by anemic offenses.
For more information on all of the Phillies, Yankees, and hundreds of other
players, and for dozens of tools to help you dominate your fantasy
league, check out Bloomberg Sports’ fantasy kits.
Hanley Ramirez No, Everth Cabrera Yes
By Jonah Keri
Hanley Ramirez is a consensus Top-2 pick.
Troy Tulowitzki’s in most people’s Top 20, and some people’s Top 10.
Jimmy Rollins’ stock has dropped a bit, but he remains a high-round
favorite among fantasy shortstop picks.
In deeper leagues, you can safely ignore all of them.
Building
your draft is all about finding value. One of the best sources of value
this year will be cheap steals – especially from the shortstop
position. In deep mixed leagues and especially NL-only leagues with 10
teams or more, several lightly-regarded shortstops figure to bring a
lot of hidden value in late rounds.
Leading that pack is Everth Cabrera. The 23-year-old San Diego Padre
swiped 25 bases in his rookie season last year, tied for 6th among MLB
shortstops.
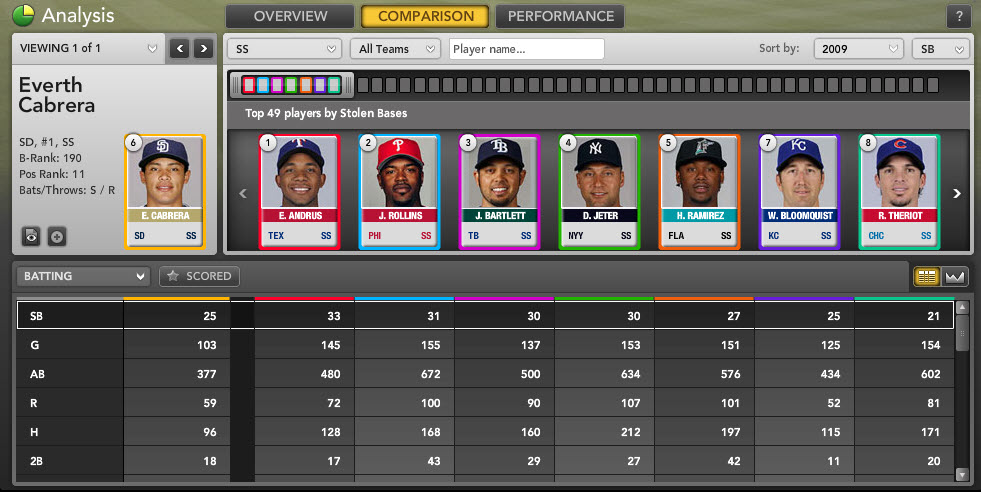
Cabrera’s impressive steals total came despite playing in just 103
games last year. Project those numbers out over a full season, and 35+
steals become a realistic goal; no MLB SS swiped more than 33 bags in
2009. Cabrera figures to get that additional playing time too. He
showed decent plate discipline, walking in 10.5% of his plate
appearances and notching a .342 on-base percentage. Cabrera also played
solid enough defense to earn his team’s trust as an everyday shortstop.
Cabrera will never be confused for a five-category beast like Ramirez.
He hit groundballs on 62.7% of the ball he hit in play last year, an
astronomical figure that severely limits his ability to rack up
extra-base hits. A look at his Spider Chart (bottom center) shows that Cabrera offered
value in the Runs Scored and Stolen Bases department. His other fantasy
categories aren’t pretty: His two home runs put him miles below the
league average even at a more power-deficient position like shortstop,
and you’re probably not knocking in a ton of runs if you’re constantly
chopping the ball into the ground either.

Cabrera’s value could hinge on his batting average. His .255 mark last
year was sub-par for someone with little to no power and a .325 batting
average on balls in play suggests that the culprit wasn’t necessarily
bad luck. On the other hand, Cabrera’s speed should work to his
advantage, helping him leg out infield hits. If he can hoist his line
drive percentage a bit higher than last year’s 14.8% and stick in the
everyday lineup, we could be looking at a .280 hitter with 80+ runs
scored and 35 steals.
Cabrera sports an Average Draft Position of 249. But his B-Rank (Bloomberg Sports’ proprietary ranking of all players) of 190 demonstrates his significantly higher upside.
Grabbing Albert Pujols or Chase Utley near the top of your draft, then waiting until the late rounds to grab Everth Cabrera (or Cubs shortstop Ryan Theriot,
a player with similar skills) as your starting shortstop and source of
cheap steals, could pay big dividends for your team this season.
For more information on Everth Cabrera and hundreds of other players,
and for dozens of tools to help you dominate your fantasy league, check
out Bloomberg Sports’ fantasy kits.
C.J. Wilson’s Potential Move To The Rangers’ Rotation
By Tommy Rancel
Spring Training marks a period of experimentation. With a month of meaningless games to fill, it’s the perfect time to try things that you would never think of once Opening Day arrives. Most experiments go nowhere and end in mid-March. Occasionally one will work, such as last season’s move of Skip Schumaker from the outfield to second base for the St. Louis Cardinals.
The Texas Rangers are doing some experimentation of their own by giving set-up man and former closer C.J. Wilson a chance to compete for a rotation spot. In recent seasons we’ve seen Adam Wainwright, Ryan Dempster, and Braden Looper make successful moves from reliever to starter – albeit to differing degrees.
It was not too long ago when Wilson was the Rangers’ closer. After solid numbers in 2007 (66 games, 3.02 ERA, 12 saves), Rangers Manager Ron Washington tapped the lefty as the team’s bullpen stopper in 2008. However, things didn’t go according to plan. In 2008, Wilson saved 24 games, but finished with a dismal 6.02 ERA in 50 games.
The biggest difference between the two seasons was a disparity in home runs. After allowing just four homers in 68.1 innings in 2007, Wilson gave up eight in just 46.1 innings in 2008.
The huge jump can be explained by a ridiculously high home run-to-fly ball rate (HR/FB). For his career, Wilson owns a HR/FB rate of 12.6%. But in 2008, his HR/FB skyrocketed to 16.8%, up from 2007 levels, when batters hit home runs on 8.2% of the flyballs hit off Wilson.
Wilson benefited from regression last year, when his HR/FB dropped to a career-low 6.3%, in the process lowered his home runs allowed per nine innings rate (HR/9) to 0.37 – also a career best. Filling the set-up role and backup closer role in support of the Rangers’ top closer choice Frank Francisco, Wilson finished the season with 14 saves and set career marks in several categories, including: wins (5), games pitched (74), innings pitched (73.2), strikeouts per nine innings (K/9) (10.26), and ERA (2.81).
Despite the career year out of the bullpen, Wilson is still auditioning for a rotation spot in the Texas Rangers rotation. Why? Because in most cases 150 innings of average starting pitching is more valuable to a team than a 60 good middle relief innings.
As strong as Wilson’s 2009 campaign was, his contributions added up to a decent but not overwhelming 2 wins above replacement level (WAR represents the number of wins a player adds to his team over your typical 25th man on a roster). According to fangraphs.com, Wilson was one of just one of 10 relievers to hit the 2 WAR threshold, showing the limited upside inherent in a role that severely limits innings pitched. On the other hand, 63 starting pitchers were worth 2 WAR or more.
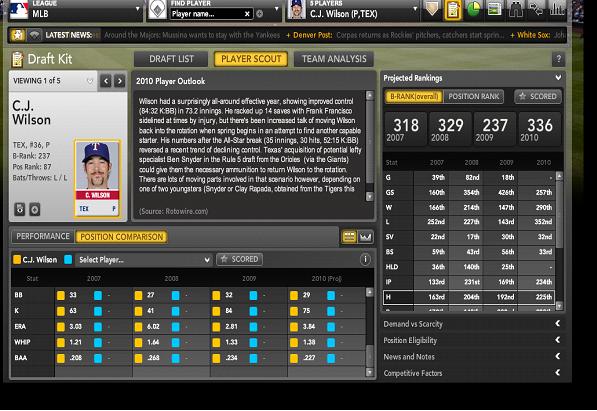
According to B-Rank (Bloomberg’s proprietary ranking of all players), Wilson’s stellar relief numbers earn him an overall ranking of 336. In most leagues he is not even drafted. On the other hand, Joe Saunders ranks 271th despite posting a nearly league average 4.60 ERA and an ugly 5.17 FIP (Fielding Independent Pitching, a stat that runs along a similar scale to ERA, while stripping out factors a pitcher can’t control such as defense and luck). He is also drafted in almost every league regardless for format. This is just another example of the value of league average starting pitching over above average relief
The move from bullpen to rotation is a tricky one. It’s generally accepted that a pitcher can see increases in ERA, strikeouts and velocity moving from the rotation to the bullpen. New Yankee Chan Ho Park is a good example of his phenomenon. As a starter, Park owns a career 4.39 ERA. His ERA plunged to 2.58 last season, on the strength of a strikeout rate that reached its highest point for a full season since 2001. Park also saw an increase in velocity: He posted an average fastball velocity of 92.2 MPH last season, up from his career average of 90.3 MPH. Even if Wilson makes a successful transition, he will likely see the reverse effect that Park – and other failed starts like Eric Gagne and Jose Mesa – experienced in moving to the bullpen from the rotation. In 2009, only two qualified major league starters posted K/9’s above 10.00: two-time National League Cy Young winner Tim Lincecum (10.42) and Justin Verlander (10.09).
In addition to the strikeouts, there are also the looming home run concerns. As mentioned, Wilson enjoyed career best marks of 6.3% HR/FB and 0.37 HR/9 in 2009. Beyond regression to the mean, neither are sustainable as a starting pitcher. In 2009, only five starters had HR/9 less than 0.50: Chris Carpenter (0.33), Clayton Kershaw (0.37), the aforementioned Lincecum (0.41), AL Cy Young Winner Zack Greinke (0.43) and Joel Pinero (0.46). Looking at HR/FB rates, five starters had rates below 6.0%, including four names from above: Carpenter (4.6%), Kershaw (4.1%), Lincecum (5.5%) and Greinke(4.5%), along with Carlos Zambrano (5.6%).
Outside of the statistical regressions, the biggest question is can Wilson handle the toll of pitching every fifth day over a 162-game season? After spending nearly five seasons in the bullpen, Wilson will be asked to throw at least 150 innings and upwards of 100 pitches per start. Last season, he threw 25 or
more pitches 14 times and never went over 38 pitches in one appearance. The good news is Wilson’s numbers reflect that he does better when pitching on more days rest. With zero days rest in between appearances, Wilson’s slash line against was .325/.385/.482 (opponents’ AVG/OBP/SLG) last year. When working on three days rest that went down to .190/.261/.238; on four days it was .190/.190/.238 on four days. (Please note small sample sizes in all cases.)
In addition to the physical aspect of starting, Wilson will need to work on pitch selection. A relief pitcher can get by with one dominant pitch and a secondary pitch. A starting pitcher generally needs at least three pitches to deal with the opposing lineup three or four times a night. Wilson has an above average fastball and a decent slider, but is lacking a true third option. In 2009, he toyed with a cut fastball and a curveball, but neither was used more than 5.6% of the time. He will need to up the usage of both pitches, or concentrate on just one as his third pitch, to balance out his pitch selection.
When taking everything into account – statistical regressions, the physical impact and pitch selection – Wilson is facing an uphill battle. But it’s a battle worth fighting. Despite being one of the games better relievers last season, Wilson was not a valuable fantasy player, because pitchers can only produce so much value (in fantasy or real life) as non-closing relief pitchers. However, if Wilson can parlay his solid historical strikeout rates into a league-average ERA as a starter, his value would jump considerably. I wouldn’t put Wilson on any draft boards as a starter right now; but you should add him to your watch list.
To keep an eye on C.J. Wilson, and hundreds of other players, check out Bloomberg Sports’ fantasy kits
Cole Hamels and the Verducci Effect
By Tommy Rancel
Sports Illustrated writer and MLBNetwork contributor Tom Verducci recently released his annual list of red-flagged pitchers for the 2010 season. The list is comprised of pitchers under the age of 25 who saw increases of 30 innings or more from 2008 to 2009. The so-called “Verducci Effect” holds that such pitchers are at greater risk of injury or weaker performance the year after their big innings jump.
The theory has been questioned in numerous places. I’ll leave the broader criticism to others. For now, I’m more interested in one particular pitcher: Cole Hamels.
Before the 2009 season, Hamels appeared on Verducci’s list. Going by superficial stats, Verducci appeared to have nailed his prediction on the Phillies left-hander. Hamels followed up his very good 2008 season (14-10, 3.09 ERA at age 24), by going just 10-11 with a 4.32 ERA in 2009 at age 25.
Hamels looked like a classic case of the Verducci Effect. But was he really?
One of my favorite statistics to use when evaluating pitchers is Fielding Independent Pitching, or FIP. The method created by Tom Tango measures on-field events pitchers can control, independent of defense: strikeouts, walks, and home runs.
Despite the big ERA from 2008 to 2009, Hamels saw a slight increase in his strikeout rate, from 7.76 to 7.81 per 9 innings, and a decrease in his walk rate, from 2.1 to 2.0 per 9 IP. His HR/9 IP rate ticked up just slightly, from 1.11 to 1.12. Hamels’ fielding independent stats tell the story:
Hamels 2008 FIP: 3.72
Hamels 2009 FIP: 3.72
These statistics suggest that factors outside Hamels’ control led to the downturn in his fantasy stats. One of the biggest factors working against him was a higher batting average on balls in play (BABIP).
In 2008, Hamels yielded a .270 BABIP, a figure that ranked substantially below league average, and suggested good luck, good defense or both helping Hamels. That number jumped to .325 in 2009, a figure well above average that likely suggested bad luck, given that the Phillies didn’t make many changes to their defensive alignment.
Hamels career BABIP now sits at .295. The smart money then, all other factors being equal, is on his 2010 ERA finishing above his 3.09 mark in 2008 and below the 4.32 finish in 2009. Hamels’ career ERA of 3.67 sets a reachable goal.
Take a look at Hamels’ profile using Bloomberg’s Spider Chart (bottom center). You’ll note that he measures well in every category except ERA and Wins, both categories that could be much improved in 2010 with better luck.

As for the attitude and mental side of the game, reports out of Philadelphia say Hamels is in a much better frame of mind headed into this season. As for Hamels’ innings count, the Phillies might ask a little less of their young lefty, with new teammate Roy Halladay on board for an entire season to serve as the kind of workhorse that Cliff Lee was for Philly after last summer’s trade.
When putting together your 2010 rotation, be sure you use Hamels’ poor 2009 campaign to your advantage. Feel free to cite last season’s rise in ERA and his sub .500 win percentage to your fellow league members. Remind them that Johan Santana is coming back and has declared himself the best pitcher in the National League East.
Santana’s average draft position (ADP) is 39.5. This means in most 10- or 12-team leagues he is off the board by the end of round four. Hamels’ ADP, meanwhile, is 86.2, putting him in the eighth or ninth round in a 10-team league. Despite the four-round difference in ADP, the two left-handers are separated by just 11 spots in B-Rank. Only four starting pitchers fall in between the pair.

This is not a knock on Santana, but more an indication of how you can steal Hamels in the mid-rounds as your SP2, or even SP3, while others shy away due to last year’s ERA jump and mediocre won-lost record. Use the Verducci Effect to your advantage, and you could snag a bargain.
For more information on Cole Hamels and hundreds of other players, and for dozens of tools to help you dominate your fantasy league check out Bloomberg Sports’ fantasy kits.
Ben Zobrist in 2010
By R.J. Anderson
The question most asked about a second baseman this off-season likely revolves around Ben Zobrist
and the likelihood of a repeat season. Few foresaw Zobrist blasting 27
home runs or posting a slash line of .297/.405/.543 (AVG/OBP/SLG) in
his first year as an everyday major league player.
Zobrist’s
B-Rank (Bloomberg’s proprietary ranking of all major league players)
comes in at 47, making him a potential value pick given his average
draft position of 58. The lower ADP could suggest that some see a
Zobrist regression. Certainly one factor that might be in play is his
gradual decline over the course of last season, particularly in his
slugging percentage. On June 1, Zobrist’s SLG stood at .624 – by
season’s end it had fallen 81 points. Zobrist’s season-ending mark
still led all full-time second basemen. But second-half performances
can often have a big impact on draft position the next spring.
The
other, more obvious concern is that Zobrist cracked 27 home runs in 599
plate appearances, after hitting 23 home runs in 1,642 minor league
plate appearances. Throughout the minors Zobrist was an on-base machine
who lacked power. Then he met up with an aspiring hitting instructor
named Jamie Cevallos – and something apparently clicked.
Perhaps
the most appealing attribute of Zobrist’s game is his versatility. He
qualifies at second and in the outfield in all leagues. Zobrist also
played 13 games last year at shortstop, making him a decent bet to
qualify at short at some point this season for leagues with five- or
10-game in-season thresholds. As demonstrated by the bold font in the
Position Eligibility chart below, Zobrist actually made starts at every
position except catcher, designated hitter, and pitcher last season –
and he did appear as a pinch-hitter in the DH slot once as well.
Zobrist
will see playing time throughout the season and should bat in the
middle of one of the better lineups in baseball. His impressive on-base
skills should create plenty of runs scores chances, and his lofty
contact rate and emerging power – even if it regresses somewhat –
should help his RBI total. Zobrist also stole a career-high 17 bases in
’09, and should get plenty of chances to run in Manager Joe Maddon’s
aggressive attack.
The influence of a hitting guru aside, the simple dynamics of regression to the mean – what Bill James called the Plexiglas Principle
– tell us that a player who sees a big jump in performance one year
should expect to pull back the following year. Expect Zobrist’s power
numbers to drop as a result. Still, his overall skill set makes him a
good get in the fifth round of your draft; especially if your
leaguemates think his ’09 breakout was really a fluke.
For more information on Ben Zobrist and hundreds of other players, check out Bloomberg Sports’ fantasy kits.
E-Jax’s Fantasy Value
In 2007, Jackson suffered through a seemingly miserable season, posting a 5-15 record and 5.76 ERA, the kind of stats that will torpedo a fantasy season. Turns out Jackson was the victim of bad luck and especially bad defense that year. Pitching in front of noted defensive sieves such as Delmon Young and Brendan Harris, Jackson yielded a stratospheric batting average on plays in play of .351. His xFIP (expected Fielding Independent Pitching, a stat that runs along a similar scale to ERA, but strips out the impact of defense, park effects and other factors outside a pitcher’s control) was nearly a run lower than his ERA, at 4.95. This was a roughly league average pitcher thrust into the worst situation.
In 2008, Jackson appeared to take a huge step forward. The big right-hander upped his record to 14-11, with a 4.42 ERA, delighting fantasy owners who gambled a late-round pick on him. But a closer look revealed that he hadn’t changed at all. Jackson owed most of the improvement in his superficial stats to a vast improvement in the Rays’ defense. According to Ultimate Zone Rating, a stat which tracks fielders’ ability to make plays in and around their assigned positions, the Rays moved from dead last in baseball in 2007 with a mark of -57.7 to first in 2008, at 74.2. Put another way: Every 10 positive UZR points add up to roughly one more win in the standings for a given team.
So Tampa Bay’s defense went from costing the team nearly six wins in 2007 to adding more than seven wins to the ledger in 2008. That’s a gigantic, 13-win improvement – one of the biggest year-to-year changes in MLB history – before any Rays pitcher made a pitch or any Rays batter took a swing. Indeed, Jackson’s xFIP actually rose from 4.95 in 2007 to 5.03 in 2008, as some of Jackson’s peripheral stats, including his strikeout rate, got worse. It seems impossible to believe that a pitcher could go from 5-15 to 14-11 and actually prove slightly less valuable to his team on a per-inning basis – but Jackson turned the trick.
After the ’08 season, Rays management saw a chance to trade a pitcher whose perceived value likely outshone his actual value, and that’s exactly what the team did – shipping Jackson to Detroit for promising outfielder Matt Joyce.
At first glance, Jackson’s debut season in Motown
could be seen as a major breakout: His ERA dropped nearly another full run to 3.62 (7th in the American League), his strikeout-to-walk ratio jumped over the key 2:1 mark, and Jackson gave the Tigers a career-high 214 innings pitched (also 7th in the AL). His xFIP slid to 4.39. Combine his increased innings total with his improved performance, and FanGraphs estimates that Jackson’s season was worth 3.5 Wins Above Replacement — or three-and-a-half more wins than a fringe major league pitcher — for Detroit.
Even in a very good season, Jackson still showed his share of flaws. First, Jackson’s season reveals a massive chasm between his first and second
half numbers. In the first half he was one of the American League’s
top pitchers, walking just 35 batters in 121.2 IP and compiling a 2.52 ERA. The
second half wasn’t as kind, as Jackson allowed more hits, runs, and
home runs while walking the same number of batters in nearly 30 fewer
innings. His full season marked of 1.14 homers allowed per nine innings was higher than average among qualified starters, a puzzling and troubling sign at Comerica Park, which suppressed homers by 2.6% compared to league average in 2009, and rates as a pitcher-friendly park compared to other MLB stadiums.
This off-season, Jackson was involved in another trade, this one sending him to Arizona. So, which Edwin Jackson should we expect to see in 2010?
Here are some factors to consider when drafting Jackson:
1. He’s moving to Chase Field.
While moving out of the American League is generally a good thing for a pitcher due to lower run-scoring totals in the NL,
moving into one of baseball’s best hitters parks is not. Chase
Field consistently ranks among the leaders in run factor – it boosted offenses by 19.3% in 2009 and 13.5% in 2008. A mistake
pitch that may found a glove in the outfield of Comerica Park last
season may not have the same fate at Chase.
2. The defense playing behind him is good, though maybe not as good. Detroit had one of the league’s top defensive units playing behind
Jackson last season, ranking fifth in team UZR at 43.6; Tigers starters Adam Everett, Placido Polanco, Brandon Inge,
and Curtis Granderson all ranked among the best defenders at their respective
positions. As was the case with Tampa Bay in 2008, the stellar defense
gobbled up many of the mistakes Jackson may have made and helped to lower his
batting average on balls in play, which in turn saved runs and lowered his ERA. The Diamondbacks, meanwhile, ranked a solid 9th in team UZR in 2009, though just 23rd in 2008, while not making many changes to their everyday lineup.
3. The offense supporting him isn’t very good. Yes, Mark Reynolds is a big time power threat (44 homers in 2009), Justin Upton is a star
in the making, and Adam LaRoche’s bat should help stabilize the first
base position. Beyond those three, the DBacks trot out a group of 20-something hitters high on potential and low on results (to date). According to our Competitive Factors tool (see image below) the Diamondbacks ranked 19th
in batting in 2009, scoring just 720 runs despite playing in a great park for hitters. Jackson isn’t a good enough
pitcher to win many games by himself, like Zack Greinke had to do last
season playing for the hapless Royals. Jackson’s going to need help, and unless Chris Young and Stephen
Drew can finally live up to their outstanding potential, Jackson will
struggle to receive enough run support to match his win totals from the
previous two seasons.

4. The NL West. This factor could work out in Jackson’s favor. Thanks to an unbalanced schedule,
Jackson will get to face the Padres and Giants a lot. Those two
teams’ offenses finished 29th and 30th in our Competitive Factor batting rankings last
season, due to both their pitcher-friendly ballparks and talent-deficient lineups. Facing those offenses adds some instant value to a pitcher’s
worth, as will traveling to Petco Park and AT&T Park, as well as Dodger Stadium (Coors Field will be the one road park in the NL West that could significantly hurt Jackson’s performance).
Edwin
Jackson currently owns a B-Rank (Bloomberg Sports’ proprietary ranking of all players) of 55 among starting pitchers. This
number looks high to me, artificially inflated by one stellar
half of baseball. You’re more likely to find better value in someone
like Carlos Zambrano, who is ranked only a few places behind Jackson. Choose wisely, my friends.
For more information on Edwin Jackson and hundreds of other
players, and for dozens of tools to help you dominate your fantasy
league, check out Bloomberg
Sports’ fantasy kits.
-Erik Hahmann
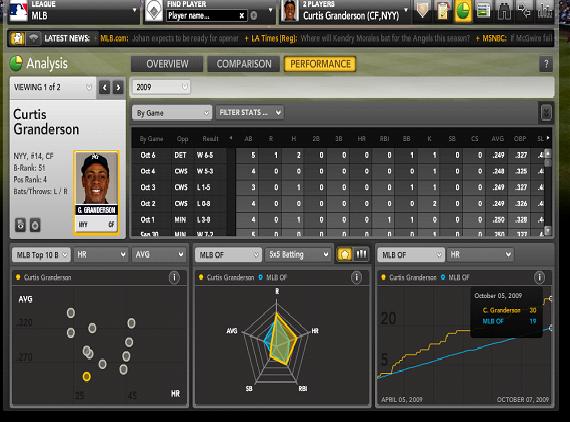
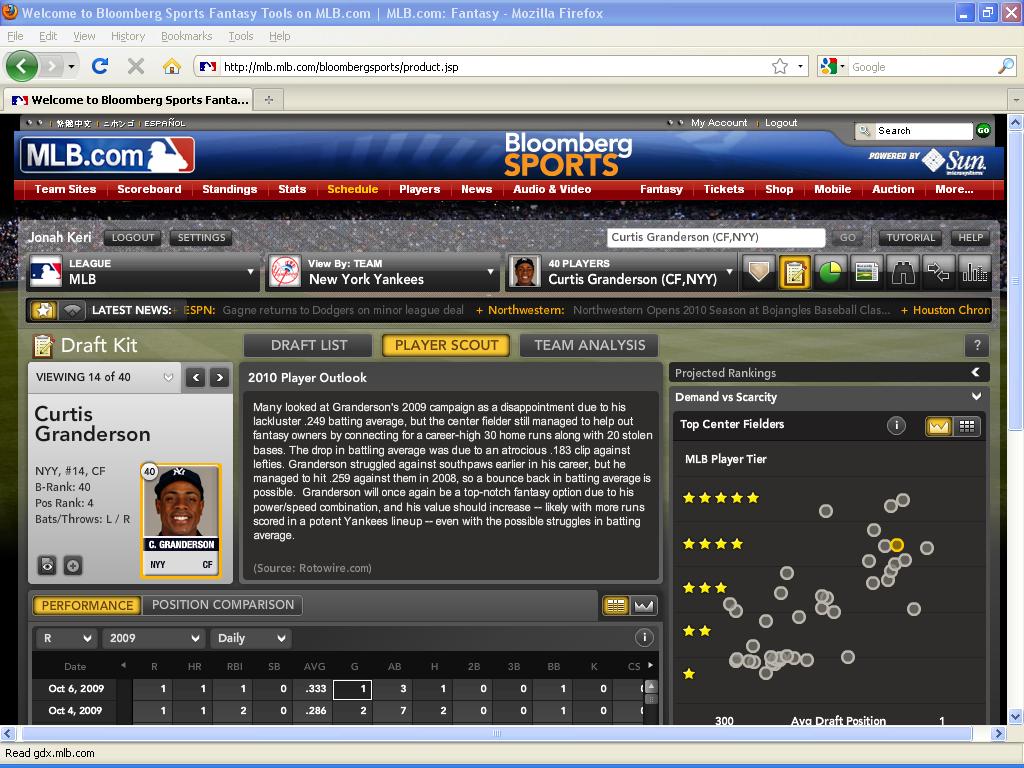
Curtis Granderson Will Enjoy Yankee Stadium
A year after making the biggest splash(es) on the free agent market, the New York Yankees went a different route this off-season. One of the biggest moves of the off-season was a three-team, seven-player trade that landed Curtis Granderson in the New York Yankees’ outfield.
Granderson, 29 next month, is now tentatively penciled in as the number-two hitter in a talented Yankees line-up. After hitting 19 home runs in 2006, his first full season, Granderson posted back to back 20-plus home run seasons in 2007 and 2008, then reached the 30-HR plateau for the first time in 2009. For comparison, the major league average for outfielders was 19 in 2009. Take a look at Bloomberg Sports’ time-line based trend chart (bottom right).
There are some concerns about Granderson’s declining batting average (career-high .302 in 2007, .280 in 2008, full-season career-low .249 in 2009). But Granderson has maintained a selective approach, pushing his walk rates over 10% in each of the past two seasons. In addition to the walks, he is due for some positive regression on balls in play. Granderson’s career batting average on balls in play (BABIP) is .323. That’s a little above the league average, but not extraordinarily high for a player with good speed. In 2009, though, his BABIP fell to just .276. Expect that number to rebound this season which would in turn improve his batting average.
Another area of concern is Granderson’s platoon splits. For his career, Granderson has hit an impressive .292/.367/.528 (AVG/OBP/SLG) against right-handed pitching, but just .210/.270/.344 vs. lefties. Last season showed an even more extreme split: .275/.358/.539 vs. RH, .183(!)/.245/.239 vs. LH. Still, several baseball analysts have argued that when a player’s platoon splits are as extreme as Granderson’s, there’s plenty of room for regression on both sides.
A true left-handed pull-hitter, Granderson’s slashing, line-drive power is a perfect match for his new home. Yankee Stadium fueled huge numbers for power hitters last year, especially left-handed pull hitters. In 2009, Comerica Park had a home run park factor of .974, the 18th-best figure for hitters in the majors (1.000 is neutral, meaning home runs were suppressed by 2.6%). The launching pad in the Bronx sported a home run factor of 1.261 (i.e. 26% above average), tops in all of baseball.
Looking at Granderson’s power numbers to each field further supports this theory. For his career, Granderson sports a slugging percentage of .510 on line drives and flyballs hit to left field, .556 to center field and a huge .744 to right field. Granderson’s home run-to-flyball ratios tell a similar story. Again moving from left to right field, here are his career HR/FB%: 4.4%, 5.9%, 29.1%(!!!) Nearly one in every three fly balls hit by Granderson to right field have gone for home runs in his career – and that’s without the benefit of Yankee Stadium’s friendly confines.
Of course you can’t mention Granderson without the player he is replacing in the Yankee lineup, Johnny Damon. Like Granderson, Damon’s slashing, left-handed swing was a perfect match for new Yankee Stadium. In his first and only season at the ballpark, Damon tied a career-high with 24 home runs and set a career high in isolated power (slugging percentage minus batting average).
Playing at old Yankee Stadium in 2008, Damon posted a .684 slugging percentage to right field, with a strong 23.5% HR/FB rate. In 2009, those numbers rocketed to .859 SLG and 31.5% HR/FB to right field. Once we factor in age, defense, contract and the likelihood that Granderson might have more natural power than Damon, you can see why the Yankees made the switch.
Currently, Granderson’s average draft position (ADP) is 56. His B-Rank of 40th overall suggests this is quite a bargain. Looking at the Demand vs. Scarcity chart, you’ll notice that Granderson is in the fourth tier of center fielders. Just to the right of Granderson’s yellow dot is another dot also located on the fourth-tier; this belongs to Grady Sizemore. Currently, Sizemore is being drafted around 13th overall, 43 spots before Granderson. However, Sizmore’s B-Rank of 32 pegs his value just eight spots ahead of Granderson. This means you can pass on Sizemore early, wait until the fourth or fifth round for Granderson, and still receive similar production.
With the expected increase in home-park influenced power, potential BABIP regression, and being in the middle of his perceived physical prime, Granderson’s 2010 season projects to be his best yet. Throw in Granderson’s average of nearly 20 stolen bases a year since ’07 and his impressive blogging skills and you have a must-get player. Draft the man.
For more information on Curtis Granderson and hundreds of other players, and for dozens of tools to help you dominate your fantasy league, check out Bloomberg Sports’ fantasy kits.
–Tommy Rancel
