Tagged: BABIP
The Bloomberg Sports Fantasy Factors Part 2
BY ROB SHAW
With more than 20 of the Major League Baseball teams turning to Bloomberg Sports as a business solution, fantasy managers can rest assured that their fantasy teams are in good hands.
Offering a trade analyzer, lineup manager, and projections for every single player in the Big Leagues, Bloomberg Sports uses an algorithm that takes into account nine Fantasy Factors.
In a previous article, we focused on ballpark, durability, age, and contract status. Now the focus is on the remaining five Fantasy Factors.
In fantasy baseball, career trends are an important aspect to be considered when evaluating players. In essence, fantasy managers like investors have to know what’s a growing stock and what’s a mature stock. A player on the rise would be a growing stock and two examples are Baltimore Orioles rising stars Adam Jones and Matt Wieters. Both players are in their mid-20s and have been improving their statistics consistently over the last few seasons.
On the other hand, Yankees veteran Derek Jeter and Alex Rodriguez are far from their prime and have recently suffered their worst seasons of their legendary careers. It’s perfectly fine to invest in a player on the decline, as long as you are realistic about what they can produce in the upcoming season.
Next, luck is a Fantasy Factor that can help forecast performance. Using an advanced statistic: BABIP, it is possible for baseball fans to find out if a player had luck on their side or if it worked against him over a given period.
BABIP is the batting average for balls in play and takes into account whether a player enjoyed a higher percentage than usual of balls in play falling for hits. For instance, if a player offers a BABIP that is significantly higher than their career norm, it is often a safe bet that in the following period his performance will regress to the previous rate.
On the other hand, if the BABIP is abnormally low, it is safe to assume the player will have better luck ahead and his batting average and other statistics will improve. The statistic can also be used for pitchers when looking at BABIP against the opposition.
Next, team support is an important fantasy factor for hitters and pitchers. For hitters, it is a matter of whether they have players around them in the lineup that they can drive in and players who will drive them in. In other words, team support has a direct impact with RBI and runs. For pitchers, it’s a matter of having run support to earn wins, plus a solid defense behind them to keep runs off the board.
Strength of schedule is the next factor, and this is all about what ballparks and teams an opponent faces. Pitching in the AL East is no easy task for pitchers who have to deal with the Red Sox offense in Fenway Park, the Yankees offense in Yankees Stadium, and additional hitters parks in Toronto and Baltimore. On the other hand, the NL West calls home to several pitcher parks and limited offenses including in San Francisco, San Diego, and Los Angeles.
Consistency is a fantasy factor, as fantasy managers have to decide whether to gamble on a player who has great potential, but also great volatility. A player like Geovany Soto seems to alternate between good years, while Torii Hunter and Yadier Molina are examples of players who seem to produce consistent numbers every given season.
To see the Fantasy Factors in action visit BloombergSports.com.
The Pro-CarGo Post
By Eno Sarris //
It’s a little tough to make the case for Carlos Gonzalez next year when you agree with many of the points made by the other side, in this case by Eriq Gardner. A lot of luck on the batted ball does go into most .340 batting averages, and Gonzalez has certainly seen a few balls clear the fence that haven’t before. He probably won’t put up the same season next year, that much we can grant.
But how much will he regress? If he regresses just a little bit, he could still be an outfielder with a .300 batting average and 25+/25+ numbers, which would probably make his owners happy even if they spent an early first-round pick on him.
The .389 BABIP is an eyesore to the sabremetrically-inclined fantasy fan. That number seems like it includes a lot of luck. But we also know that every player has their own ‘true’ BABIP level, based on their unique blend of speed and batted ball mix. Peter Bendix once created an xBABIP calculator to see what an expected BABIP might be, given these factors, and using that calculator we find that CarGo’s xBABIP this year is .349. The difference in hits would be 18 hits if he featured his xBABIP instead of his BABIP, and his batting average would instead be .308 instead of .341. Gonzalez could be a little less lucky and still have a strong batting average next year.
The fact that he is showing the best power in his career doesn’t necessarily mean that he won’t come close again next year. His ISO this year is .270, last year it was .241. In the minor leagues, it was .194 overall, but .291 in his final stop. If he retreats to an ISO between his last two major league numbers, he’ll be in among Mark Reynolds, Troy Tulowitzki, Carlos Quentin and Vernon Wells on the ISO leaderboard. His power likely won’t disappear completely in other words, especially if he still calls Coors Field home, since he has a career .292 ISO in 155 home games.
About his flyballs and the HR/FB rate, those numbers fluctuate from year to year. Last year, he hit 38.8% flyballs, and 16.7% HR/FB. This year, those numbers are 36.9% and 20.9%, respectively. In the minor leagues, his full-year flyball rates fluctuated from 30.7% to 43% at different stops. He could easily hit more flyballs next year, have fewer home runs per flyball, and not see a huge drop in his home run total.
One last note. Gardner mentions the lineup around Gonzalez as a negative, but it seems like more of a positive to this analyst. As Todd Helton and Clint Barmes have declined or shown their flaws, they have lost at-bats to younger players, and Ian Stewart, Dexter Fowler, Eric Young Jr. and Seth Smith all have upside beyond their current levels. Projecting an entire lineup is iffy either way, but let’s just say: Carlos Gonzalez is the number-three hitter for the Colorado Rockies. In 2009, the three-hitter for the Rockies accrued 92 runs and 100 RBI. As long as the offense stays somewhat similar and Gonzalez stays healthy, he will likely approach 100/100 numbers in those categories.
If you pro-rate out CarGo’s 2009 totals to 600 plate appearances – which is problematic considering he only accrued 317 PA, but let’s do this for the sake of comparison – he might have had 25 home runs and 30 stolen bases. Add a batting average close to .300, and you still have a very exciting young player worth a very high draft pick, especially in leagues that break out the outfielder positions and count CarGo as a center fielder.
Gonzalez’s numbers in 2011 might not look like 2010’s gaudy Triple Crown-contending statistics, but the power and speed are real, and there’s little reason to think that next year’s Rockies lineup won’t allow him to accrue 100 runs and 100 RBI yet again. He’s a great keeper and a great first-round investment next year. Auction managers should remember to temper their power expectations when bidding, but otherwise it’s all “go CarGo” here.
For more on Carlos Gonzalez and other power/speed outfielders, check out Bloomberg Sports’ Fantasy Tools.
BABIP Laggers, xBABIP and Fantasy Rebound Candidates
by Eno Sarris //
We’ve quoted Russell Carlton’s study about the benchmarks when different statistics become significant plenty of times here. In that study, he basically asked how long it took for a statistic to reliably predict itself in one season. Given a batter’s batting average, for example, how many plate appearances does it take until that average predicts his future in-season batting average to a 70% reliability? The answer, in this case, is never. Batting average is one of the most volatile statistics in baseball, and subsequently we’re always chasing those hits in fantasy play.
While batting average itself doesn’t normalize quickly, there are some interesting quirks in the component pieces. For example, line drive rate becomes significant within 40 plate appearances. In other words, the poor-line-drive-hitting players do actually have something to worry about in the early going. While BABIP doesn’t become significant over one season, one of the main components of BABIP – line drive rate – steadies rather quickly.
It follows that players with poor BABIPs are not created equally. A player with a poor line drive rate (the average line drive rate is around 19%) may end the season with a poor BABIP, and therefore a poor batting average. That makes our mission clear. Let’s take a look at the 10 worst BABIPs in the majors, courtesy of FanGraphs. Not surprisingly, the list is filled with under-achievers.
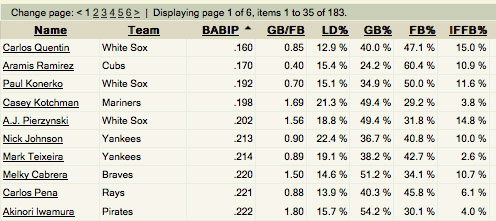
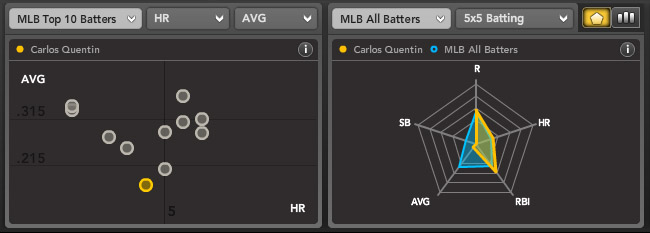
It’s nice how quickly you can get a sense of which of these players is more ready for a rebound in batting average than the rest. For example, Carlos Quentin may have something to worry about. He’s just not centering the ball, and with a poor line drive this year as well as over his career (15.7%), he may actually end up being a guy with power and poor batting averages once we look back on his full career. That’s another way of seeing how misleading batting average can be – even though we are more than 1500 plate appearances into Quentin’s career, there’s a non-zero chance that he’s better than his .248 career batting average so far. On the other hand, this spider graph from the Bloomberg Sports Fantasy Tools might actually show us who he really is.
 There are other names on that list that pop out as ready to bust out. We’ve heard a million times how Mark Teixeira is just a slow starter, he’s got an average line drive rate, and for some reason nearly 80% of his balls in play are becoming outs. That shouldn’t continue, nor should Casey Kotchman continue to be this unlucky on balls in play.
You can use a player’s batted ball profile – their groundballs, flyballs, line drives – and their speed – measured by stolen bases for now – to predict what their BABIP should be. This stat, often called xBABIP, does a good job of pointing out which players are ready for the rebound as well. Here’s the original article, by Peter Bendix and Chris Dutton, that also included an xBABIP calculator.
 Check out the same 10 players from above, with their batting average, BABIP and xBABIP as columns. Players with the highest xBABIPs on this list suffer from the worst luck and are therefore the best bets for improved batting averages in the future.
So there you have it. Feel good about Nick Johnson, Teixeira and Kotchman, and worry a little about Quentin and Aramis Ramirez in particular. BABIP is always a useful tool when looking at slumping batting averages, but xBABIP and its component stats help us complete the picture.
Statistics updated through 5/9/10. For more on players with slumping batting averages, check out Bloomberg Sports Fantasy Tools.
Fantasy Baseball Intelligence, Episode 6
By Jonah Keri //
In Episode 6 of Fantasy Baseball Intelligence, Bloomberg Sports’ Wayne Parillo and I discuss advanced stats, and how they may help you win your fantasy baseball league.
Here’s the direct link to the podcast. To subscribe to an RSS feed of Bloomberg Sports’ podcast, head here, or check out Fantasy Baseball Intelligence at iTunes.
Will Alex Rios Rebound in 2010?
By Tommy Rancel
For the first five years of his career, Alex Rios was a productive hitter. From 2004 to 2008, he averaged .288/.338/.455 (AVG/OBP/SLG). But after a slow start in 2009, he was placed on waivers by Toronto, then given away to the White Sox for no compensation other than the amputation of his bloated contract. Overall in 2009, he hit just .247/.296/.395. His batting average was just .199 after moving to Chicago.
Despite the dip in those slash numbers (AVG/OBP/SLG), Rios still hit 17 home runs and stole 24 bases, providing continued value for fantasy owners.
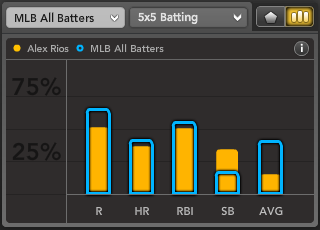
Obviously, the most alarming loss for Rios came in batting average. In 2006-2008, his batting average was .297. His 2009 average of .247 represents a 50-point drop. For a speedy player who was only 28 years old, this was odd.
Sure enough, when we look at his batted ball data from last season — notably batting average on balls in play (BABIP) and his percentage of line drives hit (LD%) — we see some outlier numbers.
Thanks to his speed and ability to hit line drives (more on that in a minute), Rios has a slightly elevated career BABIP of .319. The league average is around .300. Last season, his BABIP dropped to .273.
Digging a little deeper, Rios has maintained a career LD% of 19.8%. In 2009, that number dropped to 16.4%.
Going even deeper into the numbers, Rios saw a tremendous drop in LD% against right-handed pitching (RHP). In his career, Rios owns a LD% against RHP of 19.8%; in 2009, that number sank to 14.7%. This is significant because Rios faced a right-hander 72% of the time last year.
Some studies, like the one here, suggest career BABIP is the best predictor of a player’s BABIP going forward. If this is the case for Rios, expect a healthy regression in batting average, and on-base percentage, towards career marks near .280 and .330.
After hitting 24 home runs in 2007, many expected Rios to become a 30/30 player; however, he is not that type of hitter. A big chunk of the balls he hits into play are line drives or groundballs (42.8% career groundball rate). This leaves little room for fly balls (37.4% career fly ball rate). Because of this, he’s averaged 19 home runs over the past three years; Bloomberg Sports projects a modest 18 homers in 2010, despite the homer-friendly climate of U.S. Cellular Field.
Meanwhile, Rios set a career-high in steals with 32 in 2008, followed by 24 more last season. Over the past three years, his success on stolen base attempts is a strong 81% (56/69). Bloomberg Sports projects 26 steals for Rios in 2010.
Although he had a down season in 2009, Rios narrowly slides into the top 100 players ranked by Bloomberg Sports; his B-Rank is exactly 100. His average draft position (ADP) is just 146.
Assuming a mid-round draft slot in an averaged size (12-14 team) mixed league, you could start your outfield with a combination like Ryan Braun, Bobby Abreu, and Rios. This trio would give you a well-rounded, durable outfield, despite using just one premium draft selection. All three players have averaged at least 620 plate appearances in the past three seasons, and provide a blend of average, (decent) power, and speed.

If we tweak the 30/30 projections on Rios down to 20/20, and add in the potential for batting average regression, we are looking at a productive third or fourth outfielder in many mixed leagues. Target him with other bounceback candidates in the middle of your draft.
For more on sleepers like Alex Rios, check out Bloomberg Sports’ fantasy kits.
Ian Kinsler, the Chase Utley Alternative
By Tommy Rancel
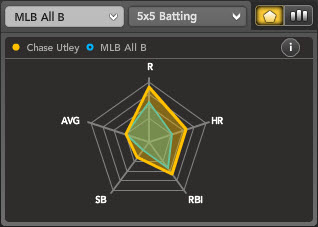
Since joining the Phillies lineup full-time in 2005, Chase Utley has averaged .301/.388/.535 (AVG/OBP/SLG) with 29 home runs and 101 RBI per season. These numbers are typical for a star corner outfielder or a slugging first baseman – not a second baseman. For example, in 2009, Utley hit .282/.397/.508 with 31 home runs and 93 RBI. The average full-time major league second baseman hit .283/.348/.446 with 17 home runs and 74 RBI last year.
Utley is a consistently elite performer who shows no signs of slowing down. But Ian Kinsler may soon pose a threat to his throne atop the second base rankings.
Kinsler one of baseball’s unluckiest players in 2009. His batting average on balls in play (BABIP) was just .241, the lowest BABIP among qualified major leaguers, and 47 points lower than his career mark of .288. This drop in BABIP led to career lows in batting average (.253) and on-base percentage (.327).
Kinsler posted a career high 54% fly-ball rate (FB%) last season, with a career-low 15.4% line drive rate (LD%). If he rebounds toward career levels (47.1% FB, 20.0 % LD) a healthy batting average regression will likely follow.
Despite the low batting average, Kinsler still had a productive season for the Texas Rangers, smoking 31 home runs and swiping 31 bases. He became just the third second basemen (Brandon Phillips and Alfonso Soriano) in major league history to record a 30/30 season.
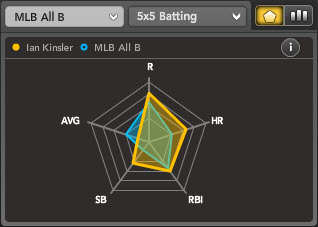
Looking at the spider charts of Kinsler and Utley, both players rate above average across the board. Utley’s batting average looks a lot better, but remember Kinslers’ BABIP fluctuation.
The final category is steals. Surprisingly, the 31-year-old, Utley stole a career high 23 bases last season after swiping 60 bags over the previous four. Kinsler has 91 career steals, including 80 over the past three years. He has increased his steals total in each of his four seasons: 11 in 2006, 23 in 2007, 26 in 2008, and 31 in 2009. Utley is on the wrong side of 30, while Kinsler is just 27; that age gap could widen the disparity in steals between the two players over the next few seasons.
One potential pitfall with Kinsler is health. In his four-year career he has spent 134 days on the DL with a variety of injuries. These include: a dislocated thumb, left foot stress fracture, sports hernia, and a strained hamstring last July. Utley missed 31 days with a broken bone in his hand in 2007, but has avoided a DL trip in the past two seasons.
Unlike previous years, Kinsler will not be leading off for the Rangers. This will give him fewer plate appearances, but should not be seen as a net negative. Instead, focus on all the increased RBI opportunities he will have hitting behind Michael Young and Josh Hamilton. In addition to the potential for more RBI, we know Kinsler’s power is real. His isolated power (slugging percentage minus batting average) has increased every season, going from .168 in 2006 to .235 in ’09.
B-Rank looks past Kinsler’s 2009 batting average and ranks him 12th overall; Utley ranks slightly higher at 10th overall. Meanwhile, Kinsler’s average draft position (ADP) of 17.2 means he could produce similar or better numbers than Utley (ADP 5.4) without expending a mid-first round pick.
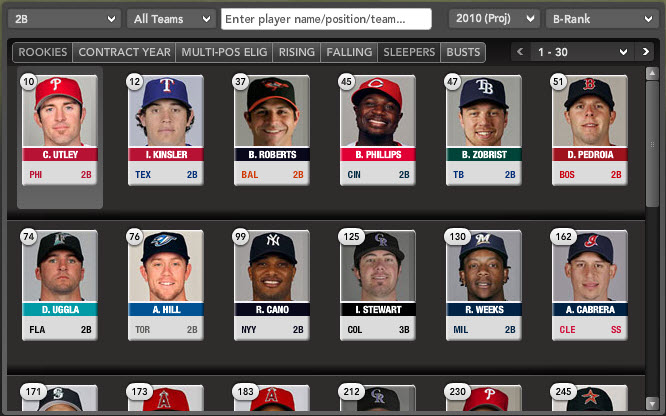
In a 12-team mixed league, a team picking late in the first round could conceivably draft a combination of Prince Fielder and Kinsl
er, a killer 1-2 punch on the right side of the infield to start the draft.
For more information on Ian Kinsler and hundreds of other players, and for dozens of tools to help you dominate your fantasy league, check out Bloomberg Sports’ fantasy kits.
Cole Hamels and the Verducci Effect
By Tommy Rancel
Sports Illustrated writer and MLBNetwork contributor Tom Verducci recently released his annual list of red-flagged pitchers for the 2010 season. The list is comprised of pitchers under the age of 25 who saw increases of 30 innings or more from 2008 to 2009. The so-called “Verducci Effect” holds that such pitchers are at greater risk of injury or weaker performance the year after their big innings jump.
The theory has been questioned in numerous places. I’ll leave the broader criticism to others. For now, I’m more interested in one particular pitcher: Cole Hamels.
Before the 2009 season, Hamels appeared on Verducci’s list. Going by superficial stats, Verducci appeared to have nailed his prediction on the Phillies left-hander. Hamels followed up his very good 2008 season (14-10, 3.09 ERA at age 24), by going just 10-11 with a 4.32 ERA in 2009 at age 25.
Hamels looked like a classic case of the Verducci Effect. But was he really?
One of my favorite statistics to use when evaluating pitchers is Fielding Independent Pitching, or FIP. The method created by Tom Tango measures on-field events pitchers can control, independent of defense: strikeouts, walks, and home runs.
Despite the big ERA from 2008 to 2009, Hamels saw a slight increase in his strikeout rate, from 7.76 to 7.81 per 9 innings, and a decrease in his walk rate, from 2.1 to 2.0 per 9 IP. His HR/9 IP rate ticked up just slightly, from 1.11 to 1.12. Hamels’ fielding independent stats tell the story:
Hamels 2008 FIP: 3.72
Hamels 2009 FIP: 3.72
These statistics suggest that factors outside Hamels’ control led to the downturn in his fantasy stats. One of the biggest factors working against him was a higher batting average on balls in play (BABIP).
In 2008, Hamels yielded a .270 BABIP, a figure that ranked substantially below league average, and suggested good luck, good defense or both helping Hamels. That number jumped to .325 in 2009, a figure well above average that likely suggested bad luck, given that the Phillies didn’t make many changes to their defensive alignment.
Hamels career BABIP now sits at .295. The smart money then, all other factors being equal, is on his 2010 ERA finishing above his 3.09 mark in 2008 and below the 4.32 finish in 2009. Hamels’ career ERA of 3.67 sets a reachable goal.
Take a look at Hamels’ profile using Bloomberg’s Spider Chart (bottom center). You’ll note that he measures well in every category except ERA and Wins, both categories that could be much improved in 2010 with better luck.

As for the attitude and mental side of the game, reports out of Philadelphia say Hamels is in a much better frame of mind headed into this season. As for Hamels’ innings count, the Phillies might ask a little less of their young lefty, with new teammate Roy Halladay on board for an entire season to serve as the kind of workhorse that Cliff Lee was for Philly after last summer’s trade.
When putting together your 2010 rotation, be sure you use Hamels’ poor 2009 campaign to your advantage. Feel free to cite last season’s rise in ERA and his sub .500 win percentage to your fellow league members. Remind them that Johan Santana is coming back and has declared himself the best pitcher in the National League East.
Santana’s average draft position (ADP) is 39.5. This means in most 10- or 12-team leagues he is off the board by the end of round four. Hamels’ ADP, meanwhile, is 86.2, putting him in the eighth or ninth round in a 10-team league. Despite the four-round difference in ADP, the two left-handers are separated by just 11 spots in B-Rank. Only four starting pitchers fall in between the pair.

This is not a knock on Santana, but more an indication of how you can steal Hamels in the mid-rounds as your SP2, or even SP3, while others shy away due to last year’s ERA jump and mediocre won-lost record. Use the Verducci Effect to your advantage, and you could snag a bargain.
For more information on Cole Hamels and hundreds of other players, and for dozens of tools to help you dominate your fantasy league check out Bloomberg Sports’ fantasy kits.
Need Another Outfielder? Choose Choo
By Tyler McKee
Many of the seats at The Jake – ahem, excuse me – “Progressive
Field'” are likely to sit empty this summer, as the Cleveland Indians
figure to muddle through another losing season.
The Tribe’s roster similarly contains some underexposed players. Shin-Soo Choo
continued to quietly emerge as one of the American League’s most
productive outfielders last season, easily outdistancing more heralded (and more desired)
players, such as teammate Grady Sizemore – despite Sizemore missing 56
games and putting up much weaker numbers than Choo in 2009.
Choo put himself in an elite class last season, becoming one of just
14 players to reach 20 home runs and 20 stolen bases. Choo is an elite outfield option with
an elite reputation, with few offensive holes in his game and
across-the-board contributions in 5X5 fantasy leagues – as shown in
this Bloomberg Sports Spider Chart.
The
chart shows Choo rating above league average in all five offensive
categories: 20 homers, 21 steals, 86 RBI, 87 runs scored, and a .300
batting average. Advanced metrics, which account for walks and other
non-fantasy contributions, show Choo with 116 Runs Created in 2009.
That total places him behind only one other MLB outfielder: Brewers hitting Ryan Braun.
Choo’s a safe
bet to play against any pitcher, given his reasonable splits. In 2009, he hit a stellar .312/.406/.504 (AVG/OBP/SLG) against right-handed pitching, and a still solid .275/.369/.456 vs. lefties.
Choo
does have one glaring weakness: he strikes out a lot – he whiffed 151 times last season. Few players can rack up strikeout totals that high and
still maintain a .300 average. A sky-high
.370 batting average on balls in play (BABIP) helped Choo pull off the feat last year; expect some BABIP
regression in 2010, and with it some downside batting average risk.
Even
with a potential batting average pullback, Choo’s all-around skills make him a great selection. It’s Choo’s potential value play that makes him most attractive, though. The 27-year-old right fielder is getting picked in the middle
rounds of drafts, with an Average Draft Position of 76. Compare
that number to Choo’s B-Rank: Bloomberg Sports’ proprietary overall
ranking slots him as #27 overall, eighth among OF. That 49-slot gap is
one of the largest for any player in our database.
Target Choo around the late-fifth or early-sixth round
in a 12-team mixed league. If you land him near that spot, you’ll have a big,
screaming bargain.
For more information on Shin-Soo Choo and hundreds of other
players, and for dozens of tools to help you dominate your fantasy
league, check out Bloomberg
Sports’ fantasy kits.
