Tagged: Fenway Park
The Bloomberg Sports Fantasy Factors Part 2
BY ROB SHAW
With more than 20 of the Major League Baseball teams turning to Bloomberg Sports as a business solution, fantasy managers can rest assured that their fantasy teams are in good hands.
Offering a trade analyzer, lineup manager, and projections for every single player in the Big Leagues, Bloomberg Sports uses an algorithm that takes into account nine Fantasy Factors.
In a previous article, we focused on ballpark, durability, age, and contract status. Now the focus is on the remaining five Fantasy Factors.
In fantasy baseball, career trends are an important aspect to be considered when evaluating players. In essence, fantasy managers like investors have to know what’s a growing stock and what’s a mature stock. A player on the rise would be a growing stock and two examples are Baltimore Orioles rising stars Adam Jones and Matt Wieters. Both players are in their mid-20s and have been improving their statistics consistently over the last few seasons.
On the other hand, Yankees veteran Derek Jeter and Alex Rodriguez are far from their prime and have recently suffered their worst seasons of their legendary careers. It’s perfectly fine to invest in a player on the decline, as long as you are realistic about what they can produce in the upcoming season.
Next, luck is a Fantasy Factor that can help forecast performance. Using an advanced statistic: BABIP, it is possible for baseball fans to find out if a player had luck on their side or if it worked against him over a given period.
BABIP is the batting average for balls in play and takes into account whether a player enjoyed a higher percentage than usual of balls in play falling for hits. For instance, if a player offers a BABIP that is significantly higher than their career norm, it is often a safe bet that in the following period his performance will regress to the previous rate.
On the other hand, if the BABIP is abnormally low, it is safe to assume the player will have better luck ahead and his batting average and other statistics will improve. The statistic can also be used for pitchers when looking at BABIP against the opposition.
Next, team support is an important fantasy factor for hitters and pitchers. For hitters, it is a matter of whether they have players around them in the lineup that they can drive in and players who will drive them in. In other words, team support has a direct impact with RBI and runs. For pitchers, it’s a matter of having run support to earn wins, plus a solid defense behind them to keep runs off the board.
Strength of schedule is the next factor, and this is all about what ballparks and teams an opponent faces. Pitching in the AL East is no easy task for pitchers who have to deal with the Red Sox offense in Fenway Park, the Yankees offense in Yankees Stadium, and additional hitters parks in Toronto and Baltimore. On the other hand, the NL West calls home to several pitcher parks and limited offenses including in San Francisco, San Diego, and Los Angeles.
Consistency is a fantasy factor, as fantasy managers have to decide whether to gamble on a player who has great potential, but also great volatility. A player like Geovany Soto seems to alternate between good years, while Torii Hunter and Yadier Molina are examples of players who seem to produce consistent numbers every given season.
To see the Fantasy Factors in action visit BloombergSports.com.
What is John Lackey Lacking?
by Eno Sarris //
With a career strikeout rate of about 7 per 9 innings, a career groundball rate of 43.6%, and only one season with an xFIP (a stat that runs along the same scale as ERA but strips out ballpark effects, bullpen support, batted-ball luck and other factors) under 3.88, John Lackey has lacked some of the traits that might point to a staff ace.
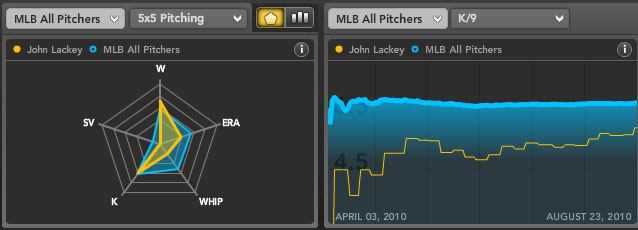 This year, the results have been worse. His xFIP has jumped to 4.51, the worst mark of his career. His strikeout rate (6.05 per nine) is the lowest it’s been since his rookie season eight years ago, and he’s walking more batters too (3.24 per 9 IP, vs. 2.70 career BB/9). The BABIP against (.328) is a little high, suggesting some bad luck, but that doesn’t explain the whole problem, as you can see from the Bloomberg Sports Fantasy Tools charts above.
Matthew Carruth wrote an interesting piece about Lackey on FanGraphs and pointed out an interesting quirk about his year. The money quote:
Lackey’s strikeout to walk rate versus righties was 3.0 in 2008, was
2.9 last year and is at 2.9 this season. Versus a lefty it has slipped
from 3.6 in 2008 and 3.1 in 2009 all the way to 1.3 in 2010. John Lackey
isn’t facing significantly more lefties this season than he did in the
past, but perhaps he should be given his collapse against them this
year.
Does this explain it all? After opening up the question on Twitter, I thought it was worth a little bit more exploration. One follower suggested the AL East and its competition level was mostly to blame. But that theory was handled by Carruth when he noted that Lackey faced batters with OPS figures of .755 and .766 the last two years – and .737 this year.
Another belief was that the parks in the AL East are much more conducive to offense than those in the AL West. According to StatCorner, the average park factor for home runs by left-handed batters in the AL West is 100 and for RHB it’s 92. In the AL East, those numbers are 104 and 108 respectively. Before we call it a day, though, it’s worth noting that Lackey has been pitching more often in Boston this year, so a comparison of Boston (83/95) to Anaheim (93/98) is more germane.
Another argument holds that Lackey’s giving up more doubles than usual due to the Green Monster. The park factor for doubles in Fenway is a sky-high 150 for left-handed batters (compared to 100 in Anaheim), so this seems plausible. Using this tool, you can even plot Lackey’s balls in play this year. Comparing his balls in play in Fenway to those in Anaheim does show this tendency. The light blue balls are singles and the dark blue dots are doubles. See the clusters out in left field? (Click on the picture for full size.)

Yes, it certainly looks like Lackey is giving up more doubles against left-handed batters, and that he is struggling against opposite-handed batters. We may have a chicken-and-egg situation with the balls in play versus lefties and his strikeout-to-walk ratio against lefties: Is he struggling to locate, or has he altered his approach against lefties after the Green Monster was rattled a few times?
We also have a battle of sample sizes at play here. Lackey’s career xFIP (expected FIP, with normalized
home run rates) against lefties is 4.13 in 852.2 innings. That’s a much
bigger sample size than his 4.82 xFIP in 92.1 innings this year. So have his skills legitimately eroded, or is this a fluke of small(er) sample size?
These questions are all difficult to answer definitively. Either way, even the most ardent Lackey-haters will have to admit that not every single one of his starts comes in Fenway, and that a pitcher who has had success against lefties in the past will probably find some way to adjust to his new surroundings. Still, fantasy managers in standard mixed leagues could do well to adjust their own Lackey strategy by avoiding lefty-heavy lineups in Fenway, just in case.
For more on John Lackey and other struggling starters, check out Bloomberg Sports’ Fantasy Tools.
