Tagged: Demand vs. Scarcity
Matt Kemp vs. Chase Utley
I’ll just get this off my chest. I love Matt Kemp. (Pause.) It’s okay, though. Because I also love Chase Utley. (And all of his pomade!)
Let’s say I’m coming up on my sixth pick in the draft, and B-Rank (the
proprietary Bloomberg ranking tool, spit out by gnome-like geniuses toiling in
the depths of the silver mountain that is Bloomberg headquarters on Lexington
Avenue), tells me Kemp is ranked fifth, and Utley is ranked 10th.
That’s just a start. Any tool worth its salt is not
trying to make decisions for you – instead it’s about giving you the
opportunity to make your (informed) decisions. And in this case, the question
is how much you value positional scarcity and consistency.
In one corner we have the rising star. Kemp’s on his way up
the charts and is projected to be the number-one center fielder in baseball
next year. He went from 12th at the position to fourth in
home runs last year, and he did it by slowly ramping up his flyball rates
(from 35.9% his first year to 38.3% last year) while still hitting line drives
in bunches (21.5% career). You can see on his scout page that his slugging
percentage was steady all year, and he didn’t hit a wall. His career
78% stolen base success rate bodes well for him to continue stealing bases at a
rate that has been top-ten in baseball at his position for two straight years. He’s
got the green light. The power is projected to continue its upward trajectory,
and his speed will stick around. What’s not to love? He’s got upside in
bunches.
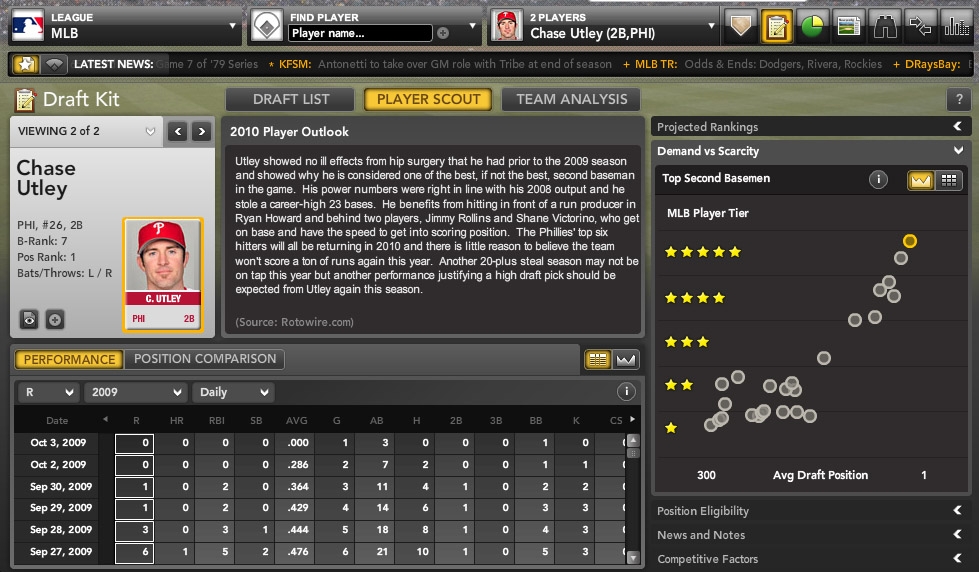
In the other corner we have the steady veteran Utley, who also
offers a blend of power and speed. Take a look at Bloomberg Sports’ player scout tool, and you’ll see
that Utley’s been number one at his position since 2007. In the past three season, he’s ranked third, first,
and second in home runs; second, seventh, and twelfth in batting average; and 16th, 13th, and sixth in stolen bases among second basemen. If you want efficiency on the basepaths, Utley is your man: He owns an 88% career success rate – and
wasn’t caught once last year in 23 attempts. Of course, his game is still built around power; Utley’s SB total last year was the
best of his career, he’s 31 years old now and has likely peaked in the stolen base department.
Power and consistency are more likely to be lasting traits. Utley’s never hit lower than
.282 in a season, or slugged worse than .508 — he’s still the consensus best second baseman on the board. Bloomberg Sports’ Demand vs. Scarcity chart shows you that only Ian Kinsler joins Utley in the category of five-star second basemen. Only seven
second basemen rate as four-star or better.
Let’s just go back to the Demand vs. Scarcity chart
for Kemp, because it’s my favorite tool in the tool belt. You’ll see that Kemp
is a five-star center fielder, like Utley is at his position, but that there are
three others in his tier. There are also 11 center fielders that are
four-star or better. If your league doesn’t break down outfielders into three
positions, Kemp’s talents become even less exceptional, as Bloomberg Sports rates 23 left fielders and
right fielders with four stars, and 11 with five stars.

If you value positional scarcity, the nod goes to Utley. If you want the young guy on his way up no matter where he plays, you
take Kemp.
For more information on Chase Utley, Matt Kemp and hundreds of other players, check out the new Bloomberg Sports fantasy application.
–Eno Sarris
Welcome to the Bloomberg Sports Blog
Welcome to the debut of the Bloomberg Sports blog, a partner of Major
League Baseball and part of the MLBlogs network. Starting today and
continuing through the final pitch of the World Series, we’ll cover all
the hot topics in baseball and fantasy baseball, with the help of Bloomberg Sports’ proprietary software and analytics.
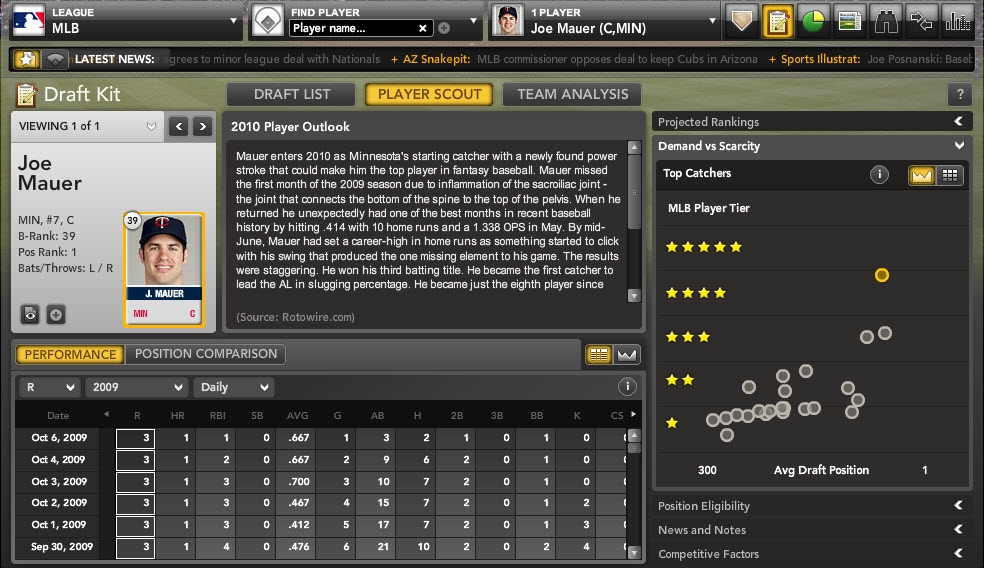
Say you’re preparing for your fantasy draft, targeting Joe Mauer as
your starting catcher. Bloomberg Sports’ Draft Kit includes rankings
for every player, called B-Rank. Using B-Rank, you’ll see how Mauer
stacks up against all other players.
You can then delve deeper. Say you want to eyeball a player’s value against others at the
same position, then make an informed decision on when in the draft to
grab him. Bloomberg Sports’ Scarcity vs. Demand graph shows you a graph
of the top 10 players at that position, how high each one should be
drafted, and where the best values might lie. If you’re scouting Mauer,
the yellow dot representing the Twins catcher will show up far above
all other catchers, a sign of his unique value.
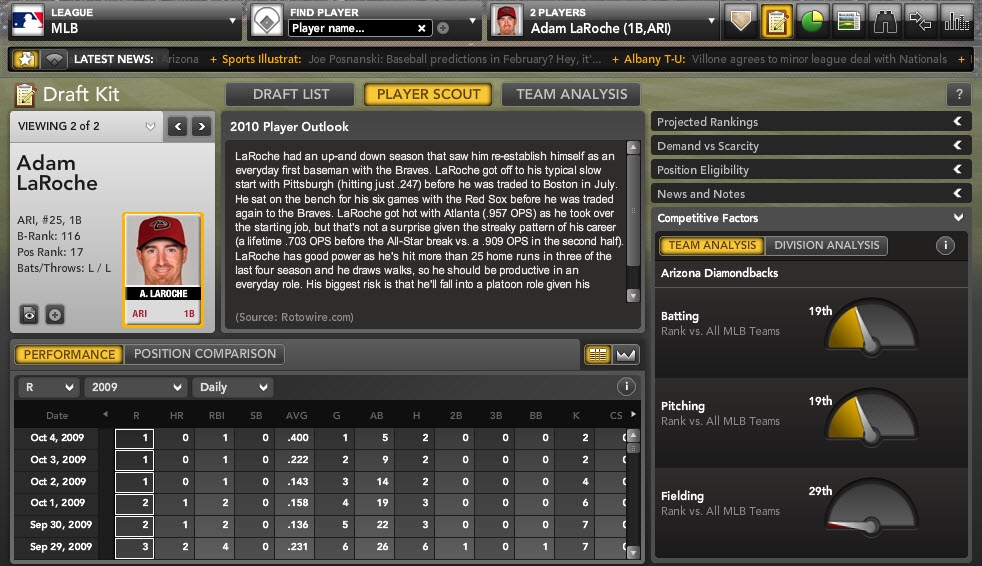
Now let’s explore a player whose ranking isn’t as obvious, newly signed Arizona Diamondbacks first baseman Adam LaRoche.
According to B-Rank, LaRoche rates 17th among all major league first basemen for projected 2010 fantasy value, given standard 5×5 criteria. In a 12-team National League-only league or deep mixed league, LaRoche would be worthy of a starting job. He would project as a mid-to-late round pick, in a cluster with decent but unspectacular players like the Dodgers’ James Loney in the Scarcity vs. Demand graph.
Using our Spider Chart, you can see that LaRoche derives most of his value from counting stats such as home runs, runs scored and RBI, with less value derived from his batting average and virtually none from stolen bases. At a glance, you can spot LaRoche’s 2009 totals in every category against other players major league-wide, or just other first basemen. His 25 home runs, for instance, placed just below the average of 27 homers for qualifying MLB starters at first base, well below the MLB-leading total of 47 at that position.
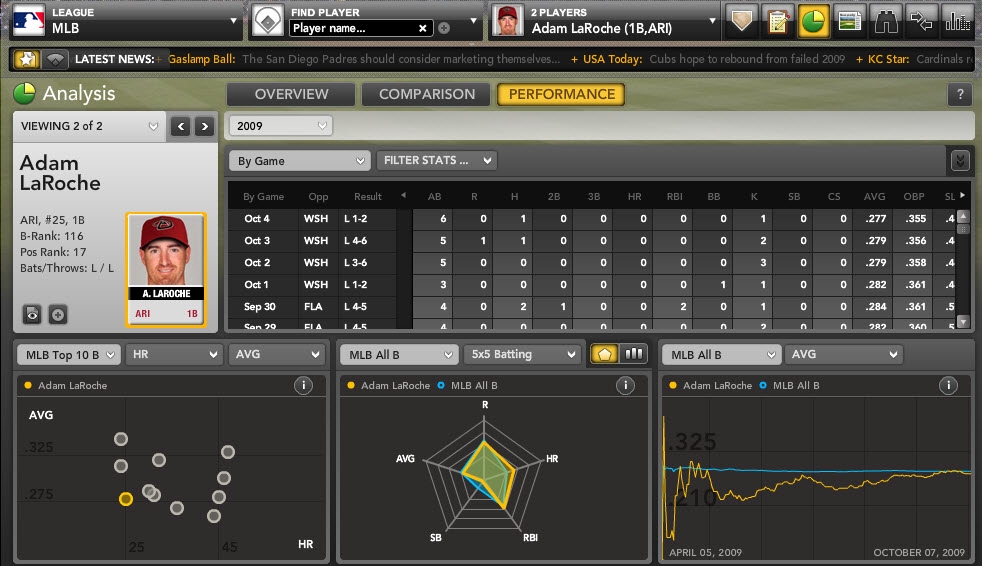
Using the Scatterplot tool, you can
compare LaRoche’s value across two categories at once, measured against the top 10 players
in that two-category combination — home runs and batting average, RBI and stolen bases, and other customizable combinations.
The Bloomberg Sports team of writers will then dig up more nuggets of information for your perusal. Say you’re satisfied with LaRoche as a low-end starter for your team. But you’re concerned about his large splits – for his career, LaRoche has batted .252/.326/.447 (AVG/OBP/SLG) in the first half, with a much stronger .300/.363/.546 line in the second half. You might then view LaRoche as someone to target in trade around the All-Star break, rather than spending a pick on him in your draft or auction.
Ascertaining why a player fares better in one half of the season compared to the other can be a tough task. Often it’s the equivalent of flipping a coin and landing on heads five times in a row: a rare but possible occurrence that’s based simply on random chance.
Occasionally there might be other reasons. Some players perform better in warmer weather, or at least hit for more power in warmer weather. In Pittsburgh and even Atlanta, where he played the bulk of his first six major league seasons, LaRoche’s power indicators jumped across the board as temperatures rose. For his career, he’s hit home runs on 12.7% of his flyballs in March and April, 11.7% in May and 12.8% in June. That number soars to 18.9% in July and 17.0% in August, making LaRoche a greater power threat in the warmer summer months. In sweltering Phoenix, LaRoche can expect average highs of 84 in April and 93 in May. By June, the Diamondbacks will likely close their retractable roof for most games, with average temperatures near or over 100 for the final four months of the season. The closed roof would in turn create cooler home playing conditions as the season wore on.
We can’t say for certain if LaRoche’s superior performance and higher power output in the second half is the result of warmer weather – it could simply be another way to look at the same random streak of better second-half performances. If it is weather-related, though, playing in Arizona, and facing warmer-weather opponents more often in the NL West, could portend a hotter-than-usual start for LaRoche.
LaRoche could also get a boost from more favorable ballpark effects. Chase Field consistently ranks as one of the most favorable stadiums in baseball for hitters – second behind Coors Field in run factor last season and second behind Rangers Ballpark in Arlington. Chase’s configuration also plays to one of LaRoche’s greatest strengths as a hitter. LaRoche has averaged 37.5 doubles per year in the past four seasons, ranking him among the league leaders in that category. Only Fenway Park, with its shallow, towering Green Monster, has yielded a higher doubles effect in the past two seasons than Chase Field.
Once the season starts, Bloomberg Sports’ In-Season tools let you
track a player’s day-today performance down to the finest details. Say
you drafted LaRoche and he got off to another slow start, hotter weather and all. The Visual Benchmark
tool lets you plot how LaRoche’s three home runs through the first 40
games of the season compare to different cohorts: other players at his
position, other National League players at his position, or the league
average for all players.
Still not sure if you should hold or cut bait? Using the
Competitive Factors tool, you can see how LaRoche’s new team stacks up
against the rest of the league. Last year, the Diamondbacks ranked 19th in batting average (20th in MLB in runs scored), despite their hitter-friendly home park. If Chris Young, Stephen Drew and other talented but erratic teammates don’t fare better in 2010, that suppresses LaRoche’s potential to score
and drive in runs – meaning you might want to consider a different option at first base.
This blog will help you leverage these and many other tools, by pairing Bloomberg
Sports analysis with the latest MLB happenings. Joining myself and
Bloomberg Sports’ Tyler McKee are the following writers:
R.J. Anderson:
His work has appeared in Baseball America, USA Today, ESPN.com, The Hardball
Times, FanGraphs, The Graphical Player, and RotoJunkie’s Annual
Baseball Draft Guide, The Fix.
Erik Hahmann: His baseball and fantasy baseball writing has appeared at Heater Magazine, DRaysBay and Beyond The Boxscore.
Tommy Rancel: He’s written for a number of publications, including Beyond The Boxscore, Inside the Majors and The Hardball Times.
Eno Sarris: He’s covered baseball and fantasy baseball for FanGraphs, Yahoo Fantasy
Baseball, RotoExperts and GodBlessBuckner on the Fanball network. He
won a Fantasy Sports Writers’ Association Award for his work at Fantasy
Lounge Sports.
Pitchers and catchers are reporting throughout the Grapefruit and
Cactus Leagues and we couldn’t be more excited to start the season.
Bookmark bloombergsports.mlblogs.com for the latest news and analysis. You’ll also find us as a Featured blog at MLBlogs.com, as well in the MLBlogs.com Pro Blogs pull-down menu, under Fantasy.
Also, follow us on Twitter @BloombergSports and Facebook.
Then, be sure to check out Bloomberg Sports’ Draft Kit and In-Season Tools.
Play Ball!
–Jonah Keri
