Tagged: Starters

Ted Lilly: Flawed But Useful?

By Eno Sarris //

The story on Ted Lilly has been fairly consistent over his career: fly-ball control-type pitcher with a great curveball, a decent slider, and a placeholder fastball. That sort of pitcher often is flawed but useful. Usually pitchers like Lilly will have poor home-run rates, but while they keep baserunners to a minimum, they can also usually be helpful at the back end of a fantasy rotation. Vanilla ice cream has its’ place.

But with Ted Lilly in his 35th year on this planet, it’s fair to ask when this run of usefullnes will end. Right now, he’s showing the worst strikeout rate (5.89 K/) and fastball velocity (86.4 MPH) of his career. Even paired with a great home park as he is – Dodger Stadium can help some of his flyballs die on the warning track – no WHIP is low enough to play a pitcher with a mid-fours ERA.

The bad news first. Lilly is not likely to recover his career strikeout rate (7.67 K/9). His swinging strike rate has steadily been dropping along with his fastball velocity, down from double digits earlier in his career to 7.9% this year. Since 8.5% is average in that category, he’s now getting whiffs on fewer of his offerings than the average pitcher. And while this is a small sample, swinging strike rate is a per-pitch metric. That means it’s much closer to reliable than metrics that are based on the outcome of a single plate appearance.

Then comes the worse news. If he’s not getting whiffs on those curveballs and sliders like he used to, then those pitches will be put in play. If those balls are being put in play, they are most likely going to be fly balls given his historical fly ball rate (34%, and 44% is average across the league). And, going back to beginning of last year, the Dodgers have the worst outfield defense in the major leagues. Matt Kemp, Andre Ethier, and the cobbled-together left field group in Los Angeles have put together a -12.4 UZR/150 (a zone-based defensive metric), and even the second-worst Braves outfield is significantly better (-8.2 UZR/150).

We can’t look to his batting average on balls in play for much regression, then. Currently sitting at .326, it should move some, but BABIP is related to defense as well. The Dodgers are only turning 70.2% of their balls in play into outs, fourth-worst in the major leagues. We can’t expect Lilly’s BABIP to move towards his .273 career BABIP if his outfield is the worst in the majors and his entire defense is fourth-worst.

Lilly is still showing his trademarked control. Since he’s moved to the National League, even his worst walk rate has been significantly better than the national average (2.81 BB/9 in 2008, average is usually around 3.4). That 2.3 BB/9 since moving to the weaker league has helped him put up a 1.14 WHIP.

But as his fastball gets slower, and his offspeed pitches get fewer whiffs, his margin of error decreases. Once those balls are put into play, we know the defense behind him won’t help him much. Even spot-starting Ted Lilly at home is becoming an increasingly risky decision. Certainly avoid him on the road for now and don’t consider him much of a buy-low.

For access to the top fantasy baseball analytics visit BloombergSports.com.

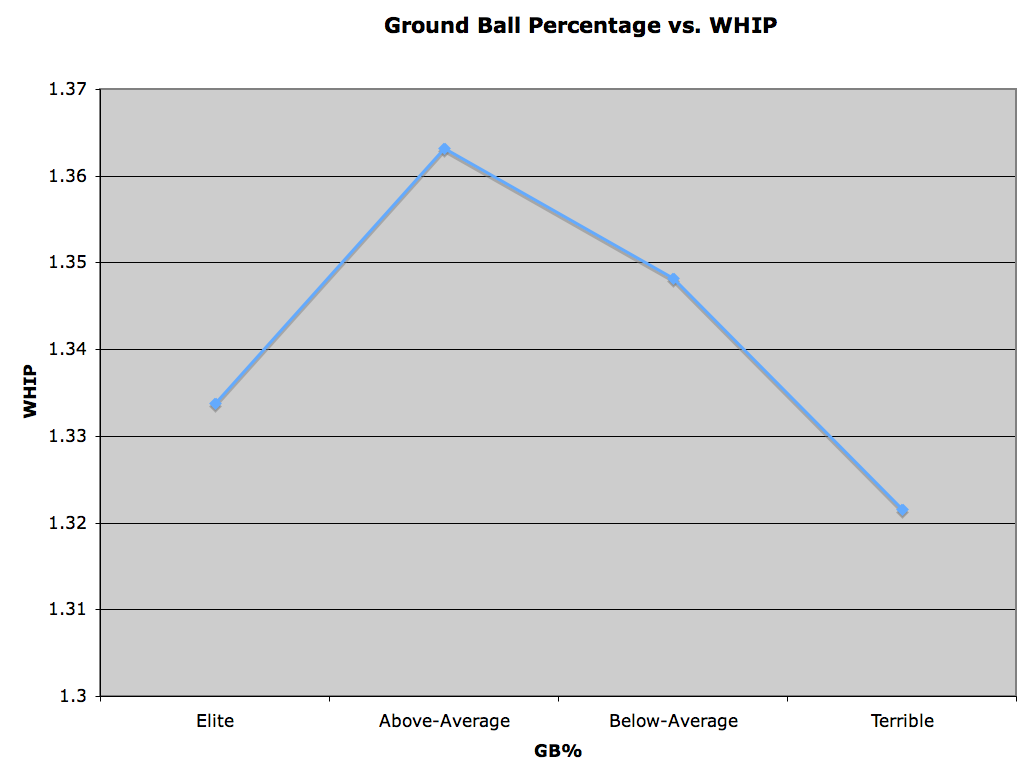
Why Fly-Ball Pitchers May Be Better Bets Than Ground-Ball Pitchers

By Eriq Gardner //

One of the fundamentals in evaluating starting pitching is to focus on three key areas where pitchers hold a measure of control over their statistical production:
  1. The ability to retire batters via strikeouts
  2. The ability to limit base-runners by avoiding the issuance of walks
  3. The ability to limit home runs by keeping the ball on the ground

Pitchers who do a good job at these three things are commonly assumed to be very skilled. Pitchers who do these things well but don’t have a superb ERA to match are seen as unlucky.

Makes sense. However, we’re not quite certain that ground-ball pitchers are better fantasy baseball assets than fly-ball pitchers. Perhaps slightly more valuable, yes, but not as profitable. Confused? Read on…
We examined statistics from starting pitchers between 2006 and 2010 to get an idea what kind of production we could expect from starters who were elite at keeping the ball on the ground versus starters who were terrible at keeping the ball on the ground. We put the pitchers into four quartiles:
  • Pitchers with elite ground-ball skills (above 47 GB%) including stars like Felix Hernandez and Chris Carpenter and lesser ones like Paul Maholm and Aaron Cook.
  • Pitchers with above-average ground-ball skills (about 44.5%-47%) including stars like Tim Lincecum and CC Sabathia and lesser ones like Joe Saunders and Jeff Suppan.
  • Pitchers with below-average ground-ball skills (about 40.5%-44.5%) including stars like Jake Peavy and Cole Hamels and lesser ones like Kevin Millwood and Kyle Lohse
  • Pitchers with terrible ground-ball skills (below 40.5%) including stars like Jered Weaver and Matt Cain and lesser ones like Jarrod Washburn and Oliver Perez.

Now, let’s look at each of the categories.

First up, here’s a look at ERA for each of these groups. You’ll notice that the ground-ball “elite” have a superior advantage over the rest of the field. It’s easy to understand why. Pitchers who don’t give up a lot of fly balls save themselves from the trouble of allowing many home runs, which tends to very unhealthy to a pitcher’s ERA. 
However, also notice that pitchers with “terrible” ground-ball rates perform better in ERA than pitchers with “below-average” and nearly as well as “above-average” ground-ball rates.
GBvsERA.png
It should be no surprise that the category of WINS tracks similarly. After all, there’s a pretty strong correlation to preventing runs and getting wins. Pitchers with “elite” ground-ball skills do best in wins, but perhaps surprisingly, pitchers with “terrible” ground-ball skills don’t do as badly as pitchers in the 25%-75% range.
GBvsW.png
So far, we’ve shown that elite ground-ball pitchers have the edge. Let’s now turn our attention to WHIP. Surprise! Pitchers with “terrible” ground-ball rates are the best of the bunch:
GBvsWHIP.png
Maybe non-HR fly balls are easy to field than ground balls and that’s why pitchers with terrible ground-ball rates have good WHIPs. 
Here’s another theory: These pitchers tend to pound the middle of the strike zone instead of nibbling near the bottom of the strike zone. As supporting evidence, we now present a look at how each of these four groups of pitchers perform in the STRIKEOUT category. As you’ll see below, pitchers with terrible ground ball rates typically get the most strikeouts:
GBvsKs.png
Obviously, ground-ball rate doesn’t always go hand-in-hand with strikeout rate. There are definitely pitchers like Ubaldo Jimenez who do a great job of keeping the ball on the ground and getting strikeouts. But the norm tends to be that fly ball pitchers do better at inducing whiffs.
Add it up and we have two categories (ERA, W) favoring pitchers with elite ground-ball rates and two categories (WHIP, K) favoring pitchers with terrible ground-ball rates. Based on the fact that wins tend to be most scarce, the edge in overall fantasy value goes to pitchers with elite ground ball rates. But do fantasy folks overestimate that edge?
Many competitors tend to focus on the sexy stats of wins, strikeouts, and ERA and give short shrift to a category like WHIP. The pitchers commanding top prices in fantasy drafts do very well in those first three categories.
How about some fly ball pitchers? The top pitchers include Cliff Lee and Jered Weaver. As for the potentially longer list of draft day bargains, think Ted Lilly, Ricky Nolasco, Scott Baker, Javier Vazquez, and Aaron Harang. Each of these players are fly ball pitchers who project to have great WHIPs and strong strikeout rates. 
At very least, there’s a floor to their prospective value that makes them good bets to at least earn back their draft investment. 
The upside for more is also there. As demonstrated above, pitchers with terrible ground-ball rates don’t do as badly in ERA and wins as one might assume. Furthermore, each of these pitchers play home games in pitcher’s parks, which may dampen the number of home runs they give up and might, very possibly, make them just as valuable as elite pitchers going very early in drafts.

Another Look at the Value of Starters vs. Relievers

By Eriq Gardner //

How do you measure an elite closer versus an elite starter in drafts?
For those who see closers as largely one-category contributors, the answer is you don’t. You measure a closer’s stability and job security and make a determination whether that closer is going to produce enough saves to justify picking one in high rounds versus a lesser closer in late rounds. Often that formula yields the conclusion that it’s imprudent to invest much in fickle relievers.
As we tried to show last year, though, closers can contribute just as strongly as starters in ERA and WHIP. 
This topic comes up every year, however, and can lead to a lot of puzzlement. In response to our post last week on safe draft bargains, one reader questioned whether Carlos Marmol should really be ranked ahead of elite starters like Justin Verlander, Jon Lester, and CC Sabathia.
Keep in mind that there’s always a margin of error when it comes to projections. The degree of confidence that the 48th ranked player will best the 49th ranked player in value by the season’s end is small. Still, the question of whether Marmol and Verlander belong in the same ballpark is definitely a valid one. 
Having considered the relative value of a starter’s ERA/WHIP vs. a reliever’s ERA/WHIP last year, let’s take a look at another category in the equation — strikeouts. 
Bloomberg Sports projects Carlos Marmol to have 105 strikeouts (most among closers) and Justin Verlander to have 198 strikeouts (second most among starters) in 2011. Both projections are on the conservative side. Bloomberg cuts 33 strikeouts from Marmol’s 2010 total and 21 strikeouts from Verlander’s 2010 total.
At first glance, Verlander’s 198 projected strikeouts seems to be more valuable than Marmol’s 105 strikeouts, but is that really true? Or stated another way, is a 200-K starter more special than a 100-K reliever?
In a standard 12-team 5×5 league, there will typically be about 60 starters drafted, or about five per team. According to Bloomberg’s projections, the average top-60 starter will have 159 strikeouts. This means that Verlander is projected to have about a 40 strikeout advantage over an average starter. That’s the difference between Verlander and someone like Ricky Romero, both in Bloomberg’s projections and 2010 totals.
How does Marmol compare to other closers? Bloomberg projects that among the 30 players projected with at least 5 saves this coming season, the average closer’s strikeout total will be 64. This means that Marmol is projected to have a 40 strikeout advantage over an average closer. Keep in mind how conservative this projection represents. Last season, Marmol had more than a 60 strikeout advantage over closers like Jonathan Papelbon, John Axford, and Francisco Rodriguez.
But assuming the projections are valid, it means that if you choose Marmol and Romero instead of Verlander and K-Rod, you should end up with roughly the same amount of strikeouts.
Strikeouts are just one category. There’s obviously ERA and WHIP too, though we think it’s been exaggerated to suggest that a reliever who only appears in about 75 innings as Marmol has the last three seasons can’t have as much value as a starter who appears in 200 innings. Not when the ERA difference is a whole run.
Let’s stipulate to the fact that that projecting wins and saves is pretty tough. No pitcher — this goes for both starters and relievers — can control the situational and opportunity factors like run support that influence a season’s win and save totals. But there are ton of starters who get wins. The number of pitchers who get saves is quite more limited. It’s a scarcer commodity, meaning that even 35 saves is typically worth more in a typical year than 20 wins. 
This is hard for many people to stomach. It’s counterintuitive to everything we know about the value of pitchers in real-life baseball. But pay attention to any fantasy baseball player rater during the course of the season and you’ll notice that top relievers rank right up there with top starters. There’s a reason.
For the best fantasy baseball analysis and insight please visit BloombergSports.com

Top 10 Injury-Risk Starters

by Eno Sarris //

Pitchers get injured. We all know this, and Adam Wainwright serves as a fresh reminder. Still, you might be surprised to learn that the average starting pitcher is 39.1% likely to hit the disabled list? Yes, two out of five starting pitchers will hit the DL this year, and for an average of 66 days. Let that sink in.

So we know that all pitchers are fairly likely to be injured, and that helps us avoid spending too heavily on pitching early in our draft. But once a pitcher is tabbed as an injury risk and falls in drafts, he could become a value. Hey, if all pitchers are 39% likely to hit the DL, how much worse could an injury risk be?

With that in mind, I used the Bloomberg Sports Front Office Tool to make a list. Using “Negative Durability” as a factor, I sorted injury-risk pitchers by their B-Rank for the next year. What follows are the Top 10 Injury-Risk Starters for the upcoming season. Click here to see the full list.

B-Rank  /  Pitcher
152 Shaun Marcum
177 Ricky Nolasco
440 Josh Beckett
670 Anibal Sanchez
748 Edinson Volquez
752 Dallas Braden
777 Brett Myers
803 Kevin Slowey
814 Jake Peavy
840 Jordan Zimmermann

Obviously, all the entrants on this list are not created equal. Shaun Marcum has averaged 169 innings over the last three seasons, Ricky Nolasco 185 and Josh Beckett 171. They may be less durable than your average pitcher, but they are more durable than the rest of this list – and that’s probably why they rose to the top. All three are projected for around 170 innings this year, and all three are generally regarded as sleepers later in your draft.

Another type of pitcher that shows up on this list are the Tommy John returners, Edinson Volquez and Jordan Zimmermann. B-Rank is skeptical about their innings totals – it projects them both for just short of 140 innings – but thinks they might be useful enough at the back end of a rotation, with ERAs around four and WHIPs around 1.3. Both have the upside to better those numbers based on their best outputs to date, but they’re also coming off major injury. Wait a little bit longer for these guys, but if you need a home run pick late, they might be for you.

Maybe the least interesting group on the list consists of injury-ridden pitchers that with less upside. Brett Myers (161 three-year IP average), Dallas Braden (152) and Kevin Slowey (136) have all averaged fewer innings than the healthier group, and don’t have the upside of the TJ survivors.

And then there’s Jake Peavy. Projected for 123 innings after averaging 128 over the last three years, he might belong in the high-upside group if you believe he can approximate his early-career work in the American League. If you believe he was more a PetCo mirage that benefited from the environs of the NL West, you’ll probably stay away. The nice thing is, he’ll be cheap if you do deign to pick him up.

And there you have your list of injury-risk starters for 2011. Naturally, they should go after the more durable at their position. But they might also provide some nice value for their cost.

For the best fantasy baseball analysis and insight please visit BloombergSports.com