By Eriq Gardner
In the first part of our look into the true value of great relievers, we described why
great relievers contribute just as much value in ERA and WHIP as starters.
Simply put, a fantasy team’s ERA and WHIP is a function of the total amount of earned runs, hits, and walks given up over the total number of team innings pitched. What matters most is finding pitchers who will save a team’s ratios from damage by limiting the number of earned runs, hits, and walks allowed.
We showed why the advantage of having great relievers instead of bad relievers is comparable to having great starters instead of mediocre ones, and it’s almost time to explain how one can get a strategic edge by leveraging the full value of relievers.
But first, we need to quickly examine two concepts that also play a role in this discussion.
The first factor is variability.
In Part 1 of the study, we noted that Jonathan Broxton is expected to save eight runs over Leo Nunez, which is not an insignificant number. However, two bad games at the beginning of April where Broxton lets up a couple of unlucky grand slams erases that advantage. Over a long-term period, we can be confident that a player will live up to his skills. But in a small sample size like 75 IP, how can we safely say that Broxton will come close to his projected 2.76 ERA?
We can’t.
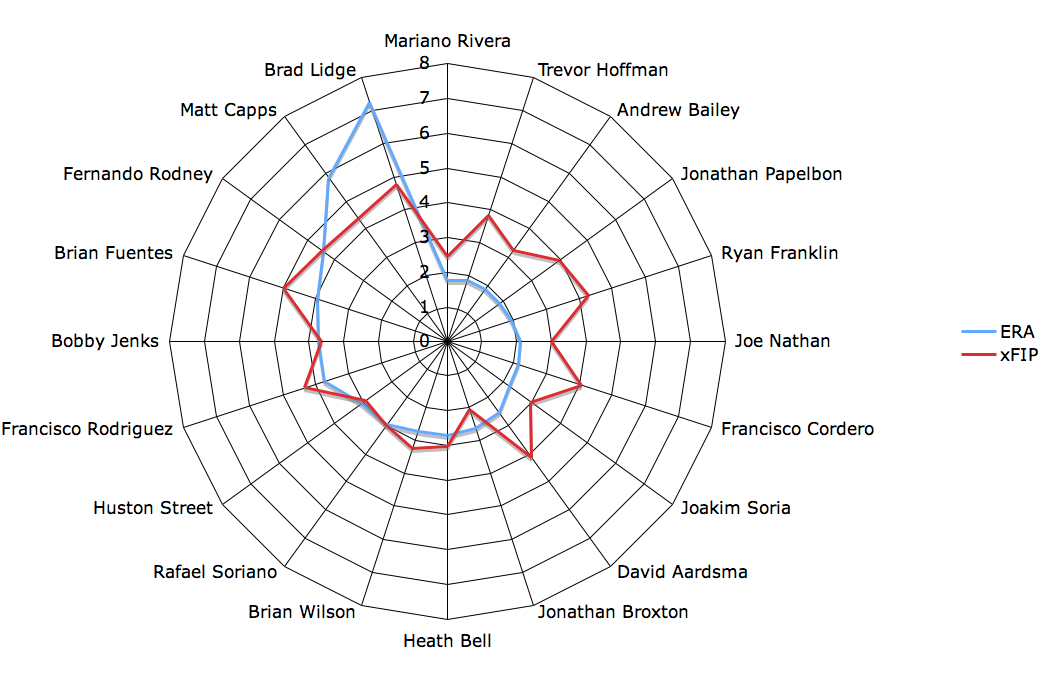
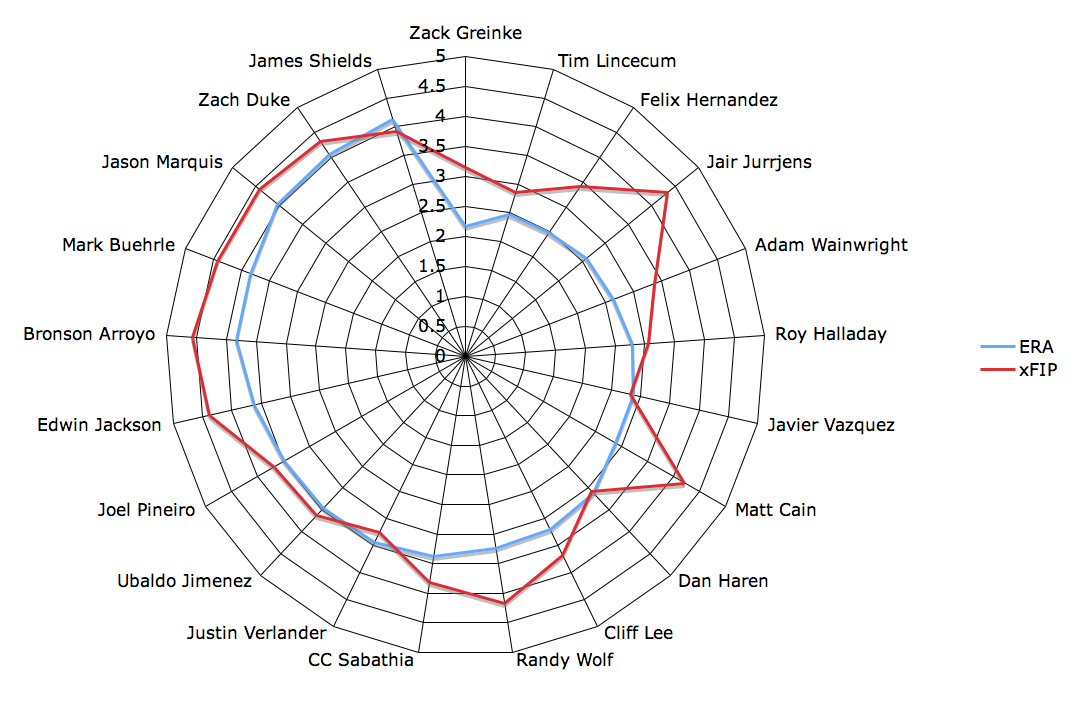
As visual proof, here’s two radar graphs which plot ERA vs. xFIP (a measure of what a pitcher’s ERA should be based on peripheral stats such as strikeout rate, walk rate and home run rate). On the left, you’ll see the 20 pitchers who pitched the most innings in baseball last year. On the right, you’ll see the 20 pitchers who gained the most saves last year. On the left, you see a little variability. On the right, you see a lot.
So if we can’t confidently project a reliever’s ERA, should we give up on the idea we should roster them with the expectation they’ll help in the category?
Nope.
The more relievers that a team has on its roster, the more closely the relievers’ ERA in aggregate will match our expectations. For instance, the average difference between the above starters’ ERA and xFIP was 0.51. For the relievers, it was 0.58. Not that big a deal if a fantasy team is willing to invest in several relievers to get the job done. A couple might underperform. A couple might outperform. In total, they should do what we expect.
Next comes the concept of scarcity.
How much of an investment (via high draft picks) does one have to make on great relievers? And if we need them in bulk to be ensured of having an impact, are there simply too few great relievers out there?
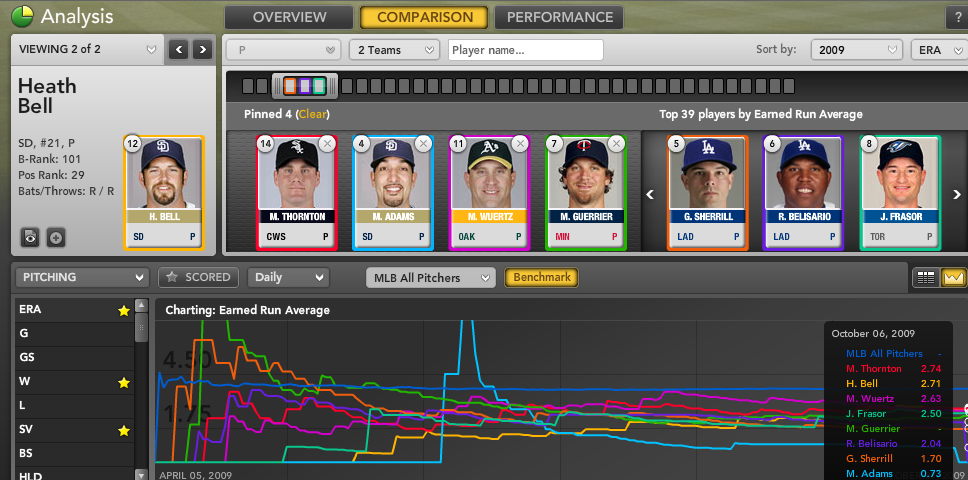
It turns out there are quite a few great relievers in any given year, and as you’ll see below, you don’t need to spend much to build a strong bullpen. Players such as
Mike Thornton,
Mike Adams,
Mike Wuertz,
Matt Guerrier,
George Sherrill,
Ronaldo Bellisario, and
Jason Frasor all put up an ERA last season that was more than a run under than the league average.
They are not alone. Yes, not all are closers, but remember that in our expansive view of the value of relievers, we’ve shown that they provide value beyond saves, and thus, it’s fair to consider middle relievers and set-up men too. In fact, anybody who looks at an in-season player rater (on service providers like ESPN) measuring the real value contributed by players will see quite a number of middle relievers near the top of the charts, largely on the strength of contributions in ERA/WHIP. Last year, for example, Wuertz was roughly the 38th most valuable pitcher in 5-by-5 roto leagues, ahead of solid closers like Francisco Cordero and good starters like Ryan Dempster.

Of course, fantasy teams need closers too, because saves do count. So now we start getting into the best strategy for rostering relievers via draft.
When looking at pitchers in general, we want to focus foremost on underlying skills — the ability to strike out batters, the ability to have control and limit walks, and the ability to limit damage by preventing line drives and home runs. A pitcher who displays these skills can be expected to save earned runs, hits, and walks over the long haul.
Some relievers such as Broxton, Mariano Rivera, Joakim Soria, and Heath Bell do all these things extraordinarily well and deserve a premium because of the added contributions they make in the saves category. It’s perfectly reasonable to select them high in drafts because they are providing strong value in ERA/WHIP plus racking up numbers in the scarcest of categories — saves.
There are other closers out there, including Frank Francisco and Chad Qualls, who also sport strong peripherals, but might get discounted because of perceived job insecurity. In the middle rounds, each makes a good target.
Finally, at the end of drafts, there’s a good quantity of middle relievers out there whose value in ERA/WHIP strongly outweighs starters being drafted late. If these great middle relievers contribute more value than mediocre starters, it makes sense to take them ahead of those mediocre starters. (Plus, these are the relievers who are most likely to be promoted to closer during the season — adding the prospect of even greater value.)
Anybody reading closely at this point might wonder about available roster room to gather all these relievers. Rostering depends a lot on context. The more roster spots per team in a given league, the more available room for relievers who will provide help in ERA/WHIP. A smaller bench might mean not as much opportunity to draft a heavy load of relievers.
That said, teams that acknowledge that late-round relievers can provide as much value in ERA/WHIP as early-round starters can use their biggest investments not on starters, but on stable hitters who won’t require back-ups, nor replacements. Having a team built upon stellar relievers saves high draft picks for a killer offense, which then saves bench room for more pitchers.
Relievers also tend to post much higher strikeout rates than starters. A team that relies heavily on reliever
s — mixing in some mid-to-late round starters with great strikeout rates such as Jonathan Sanchez and Jorge De La Rosa — can compete strongly in the category of strikeouts too.
What this all adds up to is the prospect that one can take advantage of a market inefficiency based on the wrongful assumption that relievers don’t contribute much value beyond saves. It turns out they go a long way to helping a fantasy team do extremely well in four of five pitching categories, at an amazingly cheap investment. By correctly leveraging relievers, fantasy teams can relax on starting pitchers and focus on winning five offensive categories. This is extremely enticing.
What’s the real lesson here? Perhaps it’s that the true value of great relievers lies in the fact that most people don’t recognize their greatness.