Tagged: xFIP
Should You Sell High on Ubaldo Jimenez?
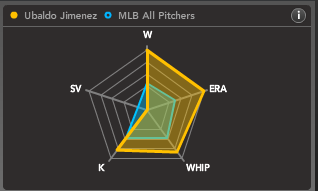
- He’s averaging about 7.99 strikeouts per 9 innings. That ranks him 26th among starters with at least 70 IP this season. He’s behind Colby Lewis, Ricky Romero, and Gavin Floyd, to name three pitchers with much less star power.
- He’s averaging 3.03 walks per 9 innings. That ranks him 54th among starters with at least 70 IP. Among the pitchers walking batters at a lower rate are Brian Bannister, Kyle Kendrick, and once again, Gavin Floyd.
- He’s averaging 0.34 home runs per 9 innings.That ranks him 6th among qualified starters. However, only 4.4% of his fly balls are going for home runs. His career rate is 7.6%, and he plays half his games at Coors Field. That’s very likely to regress.
- His strand rate is 87.8%, meaning 87.8% of the runners he puts on base don’t score. That’s largely a function of fortuitous timing (pitching abnormally and probably unsustainably well with men on base), as well as unusually strong bullpen bullpen. That’s also the luckiest rate in the entire major leagues.

Dan Haren’s Fantasy Value: Don’t Fear the Splits
by Eno Sarris
Sometimes a player just can’t get any respect, despite consistent excellence. That might be the case with Arizona ace Dan Haren.
The good news is that over the last three years, he’s posted ERAs of 3.33 or lower, WHIPs of
1.21 or lower, microscopic walk rates of 1.8 per nine innings or lower, and a strikeout rate above 8 K/9 IP. FanGraphs’ Expected Fielding Independent Pitching stat (xFIP), which runs along a similar scale to ERA and isolates factors a pitcher can best control such as home run rate, walk rate and strikeout rate and adjusts for park effects, defense and other factors, shows Haren ranking 4th in MLB in 2009 (3.08) and 4th in 2008 (3.21). Consistency is part of Haren’s oeuvre.
Take a look at Bloomberg Sports’ Fantasy Baseball Kit and several other numbers jump out at you. Haren was better than 75% of starting pitchers in strikeouts, and also sported an elite WHIP. Toiling for the 70-92 Diamondbacks kept Haren from amassing an impressive number of wins (he settled for a still solid 14), but there’s room for hope there as well. The D-Backs’ 720 runs scored last year were average for the National League (8th out of 16) and with a few steps forward from youngsters Justin Upton and Stephen Drew, the team could add to that total – especially in a hitter-friendly park. In the end, though, those factors don’t matter all that much. If Haren nets another season with the 16th-ranked ERA, first-ranked WHIP, and sixth-ranked strikeout total in baseball, you’ll be happy.
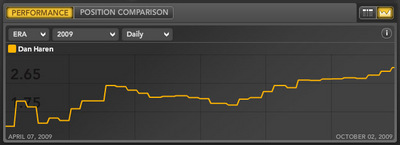
Still, much has been made about Haren’s first half vs. second half splits; the Bloomberg Tool again shows us graphically what the naysayers are saying. You can see that Haren’s ERA rose as the season wore on in 2009. This is not a new development. Take a look at his career pre- and post-All Star splits: In 651 pre-All Star innings, Haren has a 3.08 ERA, 1.06 WHIP and a 7.45
K/9. In 575 post-All Star innings, he has 4.21 ERA, 1.32 WHIP and a
7.76 K/9. Those numbers include a mediocre career 4.58 ERA and 1.31 WHIP in August.
 But that doesn’t mean you should draft Haren and trade him at the All Star break, or worse, pass on him entirely. The pre- and post-All-Star K rates were an early clue. But if you take ERA and WHIP out of the story and focus on underlying statistics, Haren is not really any different after the break, or even in his supposedly worst month of August.
To strip luck and other factors out of the equation, let’s return to Fielding Independent Pitching, the brainchild of baseball researcher Tom Tango. The expected version of FIP, xFIP, normalizes for home run rates given a pitcher’s ballpark and league situation. Listed on FanGraphs.com are Haren’s month-by-month xFIPs for his career: 3.82, 3.72, 3.73, 3.54, 3.37, 3.64. That’s right, over his career, Haren actually has his lowest monthly xFIP in August.
So why the ugly ‘regular’ stats? Since xFIP normalizes home run rate to a pitcher’s career average, it removes the effect of Haren’s biggest August problem – his 1.58 home runs per nine innings. His career home run rate is 1.03 home runs per 9 IP. You might argue that Haren tires late in the season and is more prone to the big fly, but there’s a fly in that ointment. Haren’s career home runs per 9 IP in September and October? 1.01. It simply doesn’t make any sense to say that Haren is tired in August but fine in September. For the more statistically inclined, there’s even a numbers-based argument against the importance of season splits like Haren’s here. Basically, they don’t exist.
But even those that don’t want to read about “r” values and other advanced statistical measures can see that it doesn’t make much sense to worry about one month. That’s doubly true when the underlying numbers don’t support the case for that one month being fundamentally worse than others.
Bloomberg Sports rates Haren as an elite starting pitcher, giving him a B-Rank of 29. That’s 5th among all starting pitchers, trailing only Tim Lincecum, Roy Halladay, CC Sabathia and Zack Greinke. Draft Haren with confidence, and don’t trade him unless you get a top-tier offer. Not even at the All Star break.
For more on why Dan Haren is good, and the horde of other starting pitchers that aren’t as good, check out Bloomberg Sports’ fantasy kit.
