Tagged: Jon Garland
Can Aaron Harang Replicate Jon Garland’s Formula?
By R.J. Anderson //
A comparison:
Pitcher A – 1,829.1 IP, 4.42 ERA, 4.7 SO/9, 2.9 BB/9, 1.1 HR/9
Pitcher B – 1,451.2 IP, 4.33 ERA, 7.5 SO/9, 2.5 BB/9, 1.2 HR/9
Pitcher A is Jon Garland before joining the San Diego Padres; Pitcher B is Aaron Harang through the 2010 season. Harang has agreed to a one-year deal with the Friars worth $3 million, making the comparison apt and timely. Garland boosted his reputation by turning in an impressive 2010 season. A combination of 14 wins, 200 innings on the nose, and a 3.47 ERA has that sort of effect on opinions. Can Harang manage the same?
Harang was one of the National League’s finest starting pitcher from 2005 to 2007. His average season included 14 wins, 226 innings, a 3.77 ERA, and a 3.75 strikeout-to-walk ratio. He ate innings, he won games, he avoided walks, he struck batters out, and he did so while pitching in a hitter’s park. Since then, Harang has struggled to recapture any semblance of those seasons. His average season in the past three seasons: 6 wins, 153 innings, a 4.71 ERA, and a (still very good) 2.88 strikeout-to-walk ratio.
Some would call the 32-year-old hittable nowadays. His batting average on balls in play over the past two seasons tops .330. Prior to 2009, Harang’s BABIP had topped .320 over an entire season only once, and that came when he was much younger. One of Harang’s career-long ailments is home runs. Yet, believe it or not, his flyball per home run percentage is roughly league average (11%). The issue with Harang’s homers is not the percentage of flyballs they represent, but rather the percentage of batted balls that are flyballs. That’s nothing that a prolonged stay in the super-friendly confines of Petco Park (and the Padres’ likely to be very good defense) can’t potentially help fix.
With that in mind, don’t be surprised if Harang becomes a worthwhile sleeper pick in NL-only leagues.
Jon Garland Returns to Los Angeles Dodgers
By Tommy Rancel //
After something of a career year in San Diego, Jon Garland has agreed to a one-year, $5 million dollar deal (plus performance bonuses and a vesting option) with the team he pitched for in the second half of the 2009 season, the Los Angeles Dodgers. In six starts in Dodger blue, he went 3-2 with a 2.72 ERA. While pitching for the Padres in 2010, he went 14-12 with a career-best 3.47 ERA in 33 starts.
In addition to the stellar ERA, Garland posted his best strikeout rate to date – although 6.12 strikeouts per nine innings (K/9) aren’t much to brag about. He also turned in his best groundball rate with 52% of the balls put in play against him burning worms.
That said, defensive independent metrics, which strip luck and defense from a pitcher’s performance, suggest Garland’s true talent level in 2010 was much closer to his 4.32 career ERA than the sub 3.50 he posted. This can be attributed to a lower-than-normal batting average on balls in play (BABIP) and pitching in Petco Park for more than half of his innings total.
In 2010, Garland’s BABIP (.267) was 35 points lower than the league average (.302). Most often the best indicator of what a pitcher’s BABIP should be is his career average. Those numbers show Garland’s mark is usually below the league’s average; however, his career .288 BABIP is still 21 points above his 2010 showing.
When looking at home/road splits, we see that Garland is the latest pitcher to rebound thanks to the “Petco Factor.” Easily one of the most pitcher-friendly parks in baseball, several pitchers have gone to San Diego for a numbers boost. Here are Garland’s home/road splits for 2010:
Home: 18 starts, 7-5, 3.00 ERA, .259 BABIP, 0.80 HR/9
Road: 15 starts, 7-7, 4.01 ERA, .277 BABIP, 1.08 HR/9
As you can see, his ERA differential was more than one full run. Closer to career levels, he allowed more balls to drop in play and more to carry over the fence on the road. The good news for Garland is Dodger Stadium is also pitcher-friendly park. In terms of ESPN’s park factors, the stadium has finished in the bottom half of the league for home runs allowed over the past three seasons.
Also working in Garland’s favor are consistency and durability. Over the past nine seasons, he has won at least 10 games and pitched more than 190 innings in each. The only other pitcher in baseball who can say he’s done the same is Garland’s former White Sox teammate Mark Buehrle.
Looking at everything in play, Garland is probably the most predictable fantasy pitcher in the National League. Expect a double-digit win total, nearly 200 innings, and an ERA around the league average. He should regress from his 2010 numbers, but landing in Dodger Stadium should soften the blow. He will start the season as Los Angeles’ fifth starter; consider him a fourth or fifth starter in NL-only leagues, and the last man on your staff in standard 12-team mixed leagues.
For more on Jon Garland, check out Bloomberg Sports’ Front Office. For more coverage of the Dodgers’ rotation check out this article on Ted Lilly and this one on Hiroki Kuroda.
MLB Season in Review: San Diego Padres Pitchers
By R.J. Anderson //
Biggest Surprise & 2011 Regression Alert: Jon Garland
Garland posted a terrible strikeout-to-walk ratio of 1.56, even worse than his already lousy career rate of 1.61. Garland made up for that shortcoming with a very fortunate .267 batting average on balls in play (league average is around .300), yielding a shiny 3.47 ERA. He also won double-digit games for the ninth consecutive year, racking up a fantasy-friendly 14-12 record. That streak could be in danger if he signs with a non-Padres team and continues to pitch as he did this season. If he stays in San Diego, expect that very low ERA to increase; if he leaves, expect it to inflate by a run or more.
Biggest Bust: Kevin Correia
After a 2009 in which he completed 198 innings with 12 wins and a 3.91 ERA, many expected Correia to be a league-average pitcher at worst, and a fantasy asset. Instead, he pitched only 145 innings, racking up a 5.40 ERA. Because of the team’s quality, Correia’s still managed 10 wins, but his rotation status for 2011 is very much in doubt.
2011 Keeper Alert: Mat Latos
It’s hard to have a much better season than the 22-year-old Latos did. A 14-10 record and 2.92 ERA in 184.2 innings pitched for someone who never threw a pitch in Triple-A is quite the achievement. Latos averaged more than a strikeout per inning. Spell his name with one t (like dominant) and keep him for the conceivable future. San Diego has its new ace.
Jon Garland Finds a Home at Petco Park
By Tommy Rancel //
After spending nine seasons in the American League, Jon Garland
is in year two of his National League West tour. The right-hander
signed with the Arizona Diamondbacks prior to the 2009 season, and was
traded mid-season to the Los Angeles Dodgers. Garland didn’t gather
much interest on the open market this off-season. He settled on a
one-year deal with another NL West team, the San Diego Padres, worth
slightly more than $5 million. In hindsight, it may have been the
smartest move of his career.
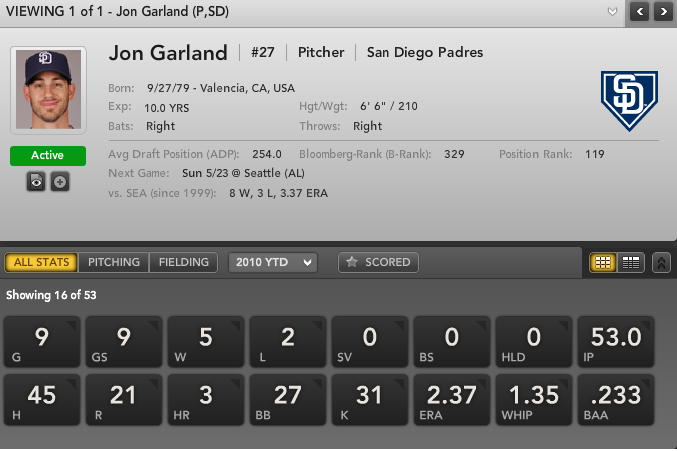
A
double-digit game winner in each season since 2002, Garland is already
halfway there in 2010. He goes into his next start with a 5-2 record in
nine starts. At first glance, his 2.38 ERA suggests a career season
thus far, but Garland has been the beneficiary of some good luck, and a
lot of home cooking.
Looking at FIP (fielding independent
pitching) and xFIP (expected fielding independent pitching), two
metrics that strip defense and luck from a pitcher’s performance,
Garland is pretty much the same pitcher he has always been. His 4.20
FIP is slightly lower than his career 4.70 FIP, but when we neutralize
his home run rate, his 2010 xFIP of 4.77 is actually slightly higher
than his career xFIP of 4.62.
Pitching in Petco Park has done
wonders for some of Garland’s numbers. The largest reason for his xFIP
being higher than normal is home run rate. In his career, Garland has
given up 1.10 home runs per nine innings (HR/9). Thanks to the spacious
dimensions of Petco – especially in right-center field – his HR/9 is
less than half that (0.51) thus far in 2010. In fact, he has not
allowed a home run in 25 innings at Petco; his HR/9 on the road is
0.96.
In addition to a suppressed home run rate, Garland has
enjoyed a lower than normal batting average on balls in play (BABIP) in
San Diego. Overall, his 2010 BABIP of .262 is nearly 30 points less
than his .289 career number. Looking at the home/road splits again, his
home BABIP of .224 is far below his relatively normal road BABIP of
.300.
Because of the lower home run and hit rates, his home
ERA (1.08) is two and a half runs lower than his road ERA (3.54). That
said, Garland has arguably been a better pitcher on the road, even if
the superficial stats don’t show it. Away from Petco, he is striking
out more than seven batters per nine innings (K/9); at home, his K/9 is
a microscopic 2.88. In addition to more Ks on the road, he is walking
fewer batters in enemy territory. He has allowed 11 walks in 28 road
innings, while handing out 16 free passes in 25 home innings (5.79
BB/9).
Regression to the mean tells us that at some point
Garland will come back to earth, and revert to career norms across the
board. However, regression doesn’t take into account that Petco Park
has been one of the most unfriendly home run parks over the past three
seasons (last or second-to-last in home runs per game every season
since 2007).
If the Padres keep up their winning ways, Garland
is likely to continue his quest for a ninth straight double-digit wins
season. However, Bloomberg Sports’ Fantasy Tools warns us of some rough patches ahead.

The
system projects Garland to go 8-10 with a 4.18 ERA for the rest of the
season. If you can live with season-ending totals of 10-13 wins, a
league-average ERA, and little in terms of strikeouts, then Garland is
a safe play. However, if you have better talents at the head of your
rotation, you might want to consider selling high on Garland. Even
Petco Park can’t prop him up forever.
For more on Jon Garland and the surprising San Diego Padres, check out Bloomberg Sports’ Fantasy Tools.
