Introducing: Bloomberg Sports Front Office Baseball for iPhone

By Jonah Keri //

Bloomberg Sports recently broke into mobile Web with its new iPhone app, Bloomberg Sports Front Office Mobile. The app takes the best features of Bloomberg Sports’ Web-based Front Office and offers them in easy-to-use, portable form.

The app’s main screen lets you choose from 1239 players. You can sort them in multiple ways, including by B-Rank (Bloomberg Sports’ proprietary ranking of every major league player), or by MLB team.

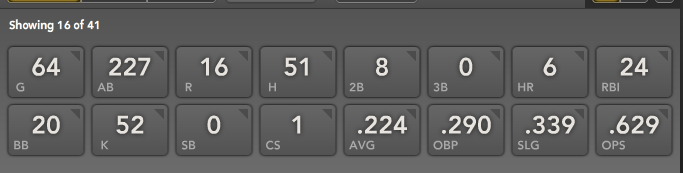
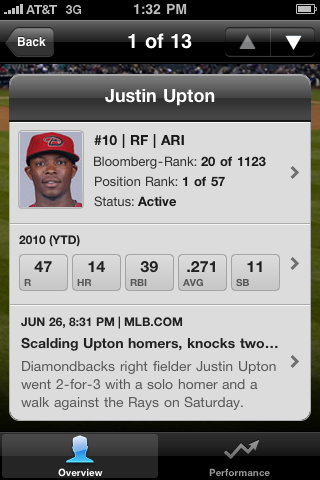
In the Overview section, you can see a player’s B-Rank, position rank and injury status. The stats section’s default display includes the five basic scoring categories for typical 5×5 leagues: HR, RBI, R, AVG and SB for hitters, W, S, ERA, WHIP and K for pitchers. Click on the arrow and you get access to a wide range of other stats, including sabermetric gauges such as batting average on balls in play, pitches per plate appearance and dozens more batting, pitching and fielding metrics across multiple seasons. The news section gives you all the latest on-field happenings and injury reports from MLB.com. You can also eyeball each player’s upcoming matchups, then make changes in seconds to get your best 23 guys in your lineup.

photo.PNG

Back to the home screen, you’ll find the My Teams tab, which gives you instant access to all the latest stats and happenings with the players who will decide your fantasy fate. Looking to upgrade your squad? The Watchlists tab lets you find the best replacements for your fantasy team in seconds, so you don’t have to wait to replace a season-long underachiever – sorry, Rich Harden – or a star now confined to the disabled list – ouch, Dustin Pedroia.

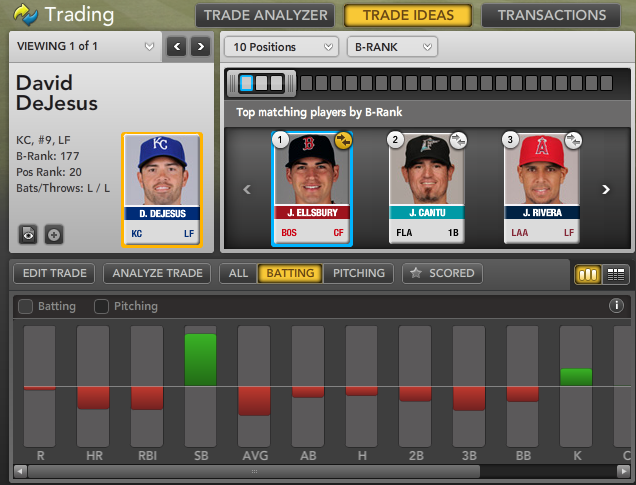
The app also lets you rank your own players, owned players, or players on the waiver wire by any combination of four categories, for those of you in 4×4 leagues or in 5×5 leagues where you’re looking to punt, say, saves and try to load up elsewhere.

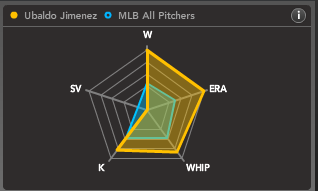
The Performance tab lets you drill deeper. You can view performance over time using Bloomberg Sports’ trend charts, tapping and holding for stats (one finger) and changes (two fingers). Use the radar chart to compare a player’s multi-stat profile with league benchmarks. For every player, you’ll find the same visually-rich charts and displays seen in Bloomberg Sports Front Office’s Web version – including the spider chart, which lets you visualize how a player stacks up to the rest of the league in five categories, with a simple glance.You’ll also find trend lines, which tell you how your player has performed compared to league average, as well on a daily basis throughout the season.

photo(2).PNG

Available in the iTunes app store (www.itunes.com/appstore), the Bloomberg Sports Front Office Baseball 2010 app is free to download, providing access to these and other features for the top 10 hitters and pitchers in each league. Information for all MLB players, as well as watchlists and personalized team settings, can be purchase as an upgrade for $4.99. Existing subscribers to Bloomberg Sports fantasy baseball Web tools can access the full app for no extra charge by using your current login information.

Give it a spin.

(Audio) BTN with guest Rob Neyer (part 1 of 2)

By Bloomberg Sports //

Listen to the conversation now! – (loads in a new browser)

This is part 1 of a 2 part interview
Hosts: Wayne Parillo and Rob Shaw
Guest: Rob Neyer of ESPN and Rob Neyer Baseball

Total Running Time: 16:03

Topics

  • Growing up a Royals fan in the 70s
  • The Holy Grail of stats
  • When the competitive balance changed

Direct link to the conversation

More ways to get Behind the Numbers or talk to us

For more on the hottest fantasy baseball topics and trends, check out Bloomberg Sports’ fantasy kits.

Should You Sell High on Ubaldo Jimenez?

By Eriq Gardner //

Picture 69.png

If the season ended today, Ubaldo Jimenez would win the Cy Young award easily on the strength of a 13-1 record, a 1.60 ERA, a 1.04 WHIP, and 95 strikeouts.
He’s been the top player in fantasy baseball this year. Yet there’s a creeping suspicion that he may be a little overvalued. 
Let’s examine the evidence:
  • He’s averaging about 7.99 strikeouts per 9 innings. That ranks him 26th among starters with at least 70 IP this season. He’s behind Colby Lewis, Ricky Romero, and Gavin Floyd, to name three pitchers with much less star power.
  • He’s averaging 3.03 walks per 9 innings. That ranks him 54th among starters with at least 70 IP. Among the pitchers walking batters at a lower rate are Brian Bannister, Kyle Kendrick, and once again, Gavin Floyd.
  • He’s averaging 0.34 home runs per 9 innings.That ranks him 6th among qualified starters. However, only 4.4% of his fly balls are going for home runs. His career rate is 7.6%, and he plays half his games at Coors Field. That’s very likely to regress.
  • His strand rate is 87.8%, meaning 87.8% of the runners he puts on base don’t score. That’s largely a function of fortuitous timing (pitching abnormally and probably unsustainably well with men on base), as well as unusually strong bullpen bullpen. That’s also the luckiest rate in the entire major leagues.

Picture 70.png

Add it together, and Jimenez’s xFIP (a measure of ERA independent of various luck factors) is 3.64 — more than two whole runs higher than his real ERA. For the rest of the season, Bloomberg Sports projects Jimenez to produce 9 wins, a 3.39 ERA, a 1.21 WHIP, and 112 strikeouts.
People toss around the phrase, “regression,” but what does it really mean? If Jimenez’s peripheral stats indicate a great deal of luck, should owners sell him now?
It depends.
First, nobody should succumb to the “gambler’s fallacy,” or an expectation that Jimenez’s great luck thus far will be evened out by unusually poor luck upcoming. Regression only means that based on peripheral stats, one should expect an ERA at about 3.3-3.6 from this point to the end of the season — and not that he’ll end up at that result at season’s close. An ERA at this level is still phenomenal. Bloomberg Sports projects him as the third-best pitcher in baseball from this point forward.
Second, deciding whether to sell him “high” depends on context. 
If you own Jimenez, do you still need great pitching? If so, it’s going to be hard to do better than what he’ll give you. 
What’s the trade offer? The presumption that he’s a sell-high candidate because an owner can trade Jimenez for a comparable pitcher like Josh Johnson, plus get something extra, although in reality, it’s not a slam dunk that a Josh Johnson owner would make this deal.
That said, perhaps there’s still an opportunity to trade Jimenez for more than what he’s really worth, to an owner who needs a pitcher and is willing to exchange a batter. In the preseason, hardly anyone gave any thought whatsoever to drafting a pitcher with the #1 overall pick. But now that Jimenez sits atop fantasy player raters as the best in baseball, it’s perhaps conceivable that a pitching-starved team trades Hanley Ramirez, Albert Pujols, Ryan Braun, or another top-notch batter for Jimenez. 
Lastly, owners shouldn’t be entirely sure that selling Jimenez now is the smart course of action, because there’s no guarantee that the Rockies’ ace really is lucky.
Sure, all the best sabermetric stats at the moment indicate he’s doing better than he really deserves, there’s always the chance that a player defies the odds for longer than a few games or a couple of months; they might even keep the good times going all season long.
For example, if I was making the case that Jimenez really isn’t quite as lucky as he seems, I’d point to the fact that his command improves when batters get on base. (His walk rate goes from 4.03 with the bases empty to 1.84 when he’s pitching from the stretch.) In turn, his xFIP in these situations drops nearly an entire run. This could partly explain why his strand rate is so tremendous. With men on base or in high leverage situations, Jimenez simply performs better. That’s probably not sustainable over the long haul, but it is possible.
Plus, peripheral stats do a good job of telling us general trends among the general population of players, but can often miss the mark when pinpointing individuals. What’s the expected batting average on balls hit in play on a pitcher whose average pitch velocity is at least 96 miles per hour? Hard to say, because there’s only been one pitcher this past decade whose reached those heights. Jimenez, of course.

So if you’re thinking about selling high on Jimenez, remember to consider context when making or fielding offers. Getting a big haul would be great. But don’t trade him just for the sake of trading him.

For more on Ubaldo Jimenez and other pitching aces, check out Bloomberg Sports’ Fantasy Tools.

(Video) Ballpark Figures: Head-to-Head

By Bloomberg Sports //

Ballpark Figures: Head-to-Head — Bloomberg Television’s Michele Steele and Bloomberg Sports Fantasy Analyst Rob Shaw prepare fantasy managers for the upcoming Trade Deadline. Ben Nicholson-Smith, the head-writer and manager for MLBTradeRumors.com joins Rob and Michele via Skype to discuss which players may be on the move, what teams would be buying, which teams would be selling, and how it will all shake out.

For more insight when it comes to trades and rumors visit MLBTradeRumors.com. For your fantasy sports data analysis visit BloombergSports.com. Also, join in the fun with a brand new fantasy game at Facebook.com/battersboxgame.

Is Francisco Liriano the Best Pitcher in the American League?

By Tommy Rancel //

Similar to the recently profiled Josh Johnson, Francisco Liriano captivated the major leagues as a rookie in 2006. As the understudy to staff ace Johan Santana on the Minnesota Twins’ staff, Liriano went 12-3 with a 2.15 ERA in 28 appearances.

In an unfortunate similarity to Johnson, Liriano blew out his arm, and would miss all of 2007. He tossed just 76 innings in 2008 and struggled in his full-time return in 2009. That said, he continues to parallel Johnson. This time, in a good way.

Through 14 turns in the rotation, Liriano is just 6-5. His 3.11 ERA ranks among the league leaders, but still doesn’t fully convey how well he has pitched in 2010. For that, we look to fielding independent metrics like FIP and xFIP. By now you know FIP and xFIP measure events a pitcher can control: strikeouts, walks and home runs. xFIP drills still further down by normalizing the pitcher’s home run rate to league average.

According to FIP, Liriano has been the major league’s best pitcher not named Cliff Lee. His 2.16 FIP in 2010 is even better than the 2.55 he posted as a rookie in ’06. Looking at his 2.99 xFIP compared to Lee’s 3.11, one could argue that Liriano has been the American League’s best pitcher.

lirianovlee.PNG

So how does arguably the best pitcher in the league have just six wins? Run support and bad luck are to blame.

Of qualified starters in the AL, Liriano owns the 10th-lowest run support, according to ESPN.com. For comparison, the Yankees have scored nearly twice as many runs when Phil Hughes toes the rubber as the Twins have Liriano pitches.

In addition to the lack of run support, Liriano has been one of the league’s unluckiest pitchers in terms of batting average on balls in play. The .348 BABIP carried by Liriano in 2010 is the third-highest in the AL; league average BABIP is .302. And while his personal BABIP has always been a bit above the norm (.316 career), his current total is by far the highest of his career.

The large BABIP number is a bit odd given the fact that the Twins employ an above-average defense, especially in the infield. I note the infield defense because 49.8% of the balls hit against Liriano this year have been groundballs, another excellent skill. Even in the absences of J.J. Hardy and Orlando Hudson, Minnesota’s backup infielders posted positive UZR (ultimate zone rating) marks*.

*Defensive statistics such as UZR usually take years of data to show true talent levels.

As noted, when looking at factors Liriano can control, he has done a wonderful job. His strikeouts per nine innings rate (K/9) of 9.71 ranks among the game’s elite. His walks per nine innings rate (BB/9) of just 2.43 suggests that his control is back to where it was pre-injury. The one category that may regress in a negative manner is home runs allowed (just two home runs allowed in 92.2 innings). But xFIP suggests that even with regression he is still among the game’s best.

Because his win total and ERA aren’t as fantasy friendly as some other starters, Liriano might be available in trade at a slight discount compared to his true worth – that of an elite starter. He’s been about as good as Ubaldo Jimenez, for instance, but with much less hype. If you own Jimenez and can land a deal that nets you Liriano and, say, a solid bat or half-decent closer, jump on it.

For more on Francisco Liriano and other underrated aces, check out Bloomberg Sports’ fantasy kits

Matt Wieters’ Disappointing Season

By R.J. Anderson //

To say Matt Wieters may have been a tad bit overhyped is more than fair at this point in the catcher’s career. Through the first 637 plate appearance of his career, Wieters slash line is a paltry .264/.322/.384. For the sake of comparison, Jason Kendall’s career line is .289/.367/.380. That’s counting some excellent seasons earlier in his career…but, still.

Everything about Wieters screams that he should be performing better than last year. His walk rate has increased nearly a full percentage point (from 7.3% to 8.1%), his strikeouts have declined (from 24.3% to 22.9%), and his ISO (slugging percentage minus batting average, an indicator of power hitting) has remained nearly the same (.124 to .115).

The elephant in the elevator is Wieters’ batting average on balls in play and batted ball profile. He’s hitting more groundballs than last year (roughly 5% more; or 47% total) and yet his BABIP has dropped nearly .100 points, to less .269 (league average is typically around .300).

wieters1.png

Generally, putting the ball on the ground means more singles and fewer extra-base hits. Yet, that doesn’t always hold true when the batter isn’t fast enough to beat out close plays for infield hits. Wieters has all of four career infield hits; that lack of speed, combined with an unhealthy dose of poor luck, have been the culprits.

The reality of the situation is that Wieters’ hype has caused fantasy owners to hold on a little longer than they should. In keeper leagues, he’s well worth a hold.

But standard 12-team mixed league owners can probably find better options elsewhere. To name two: Angels’ catcher Mike Napoli’s already reached double-digit home runs, and Miguel Montero recently returned for the Diamondbacks and is mashing, while hitting in the middle of the Arizona lineup.

For more on Matt Wieters and other catchers, check out Bloomberg Sports’ Fantasy Tools.

David DeJesus’ Walk on Water Act

By R.J. Anderson //

Few major league hitters have been hotter over the past 30 days than David DeJesus. The Royals’ outfielder is hitting .442/.500/.611 during that time, with a walk-to-strikeout ratio just under 1.00 and a .500 BABIP. He’s right next to Aubrey Huff, Josh Hamilton, and Robinson Cano for the title of best performer of the past month.

For the season DeJesus is now batting .325/.394/.482; a career best line for the 30-year-old and a well-timed one at that. The trade deadline is a little over a month away. With contenders looking to stock their shelves for a playoff run, DeJesus’ name is bound to pop up more than normal. That’s especially true for clubs like the Atlanta Braves, who could not only use another outfielder, but a top-of-the-lineup bat too. Of course, whether the Royals choose to trade DeJesus is up in the air. They have some internal replacements and it seems like an obvious opportunity to make a deal, yet none of that has really stopped them from doing the unexpected.

DeJesus’ seasonal BABIP is a career high, which suggests that he’s not going to continue getting hits at this pace. He’s not hitting for much additional power either (his ISO – slugging percentage minus batting average – is nearly identical to previous years) so most of these extra hits have been singles. He’s not even walking that much more than normal (a whisker shy of 10%), although he is striking out at a career-low rate, but just barely (a little less than 14%).

dejesus1.png

DeJesus has always been a consistent hitter; batting at least .285 every season but one since breaking into the majors in 2003. He’s also racked up at least double-digit homers each of the past two seasons and stolen a few bags here and there too.

While that consistency helps, DeJesus’ overall average package isn’t all that exciting for standard 12-team leagues; that most fantasy leagues don’t count defense creates an even bigger gap between his real-life value (substantial) and fantasy value. If you own DeJesus, consider selling high. His numbers stand a good chance of regressing, and the added risk of being him traded to the National League makes it a good time to cash in.

For more on the hottest hitters, check out Bloomberg Sports’ fantasy kits

Marlins’ Josh Johnson Is the South Beach Secret

By Tommy Rancel //

It is hard to be 6-foot-7, 250 pounds, and go unnoticed in any walk of life. It is even harder to be that large, in addition to being a highly successful athlete in a major city, and still go unnoticed. However, Josh Johnson of the Florida Marlins is all of the above, and barely generates a buzz on the national landscape.

The Marlins’ right-hander has been one of the National League’s best-kept secrets for a few years now. But in 2010 he is on the verge of breaking out. Johnson won 12 games as a 22-year-old rookie in 2006. Unfortunately, Tommy John surgery wiped out nearly all of his 2007 and 2008 seasons. Since his return, Johnson has been fantastic. Peter Gammons notes that since his full-time return in July of 2008, Johnson is 30-8 with a sub 3.00 ERA.

After going 15-5 last year, the Marlins rewarded their ace with a four-year contract worth $39 million. Looking at his 2010 season to date, there is no doubt they are glad they got the deal done when they did.

In 15 starts, Johnson is 8-3 with a 1.80 ERA. He has 98 strikeouts and just 26 walks in 100 innings. His FIP (Fielding Independent Pitching), which measures home runs allowed, walks, and strikeouts, is an NL-best 2.56 – better than Ubaldo Jimenez, Roy Halladay, and Tim Lincecum.

Speaking of Jimenez, Johnson has 10 more strikeouts, 10 fewer walks, and has surrendered just one more home run than Jimenez, despite less than a two-inning gap between the two aces. Jimenez has grabbed the national spotlight – and deservedly so – but outside of wins and ERA – two metrics that rely heavily on outside factors – Johnson has been just as good, if not better.

johnsonjimenez.PNG

Currently, Johnson is doing something not even Jimenez has been able to accomplish. In fact, it has only occurred a handful of times in major league history. Greg Cote (via Rob Neyer) tells us that Johnson’s recent string of eight straight starts with one run or less allowed is just the eighth such streak in MLB history. During that stretch, Johnson is 5-1 with a 0.63 ERA.

Beyond the microscopic ERA, and the pace for 17-19 wins, Johnson is having a career year in several other categories. Going back to FIP metrics, Johnson is striking out more batters than ever, while walking fewer and allowing fewer balls to leave the yard.

His strikeouts per nine innings (K/9) rate of 8.82 is a half-strikeout better than last season – his previous career best of 8.20. His walks per nine innings (BB/9) rate of 2.34 represent a career low. He has allowed just four home runs in 100 innings, which puts his HR/9 (home runs per nine innings) rate at just 0.36, another career best.

Johnson.PNG

Despite the stellar marks in numerous categories, we know better than to completely take some of these metrics at face value. The strikeouts and walks are what they are, but in most cases, a low ERA is likely a product of defense and luck. Luck is also sometimes a factor in the number of home runs a pitcher allows.

It is true Johnson has been somewhat “lucky,” but not enough to discredit his fantastic start as anything but that. Johnson’s batting average on balls in play (BABIP) of .270 is a bit lower than the league average (.302). If he regresses toward his career number of .301, he will allow more base runners, and in turn have a greater chance of giving up more runs.

In conjunction with BABIP, Johnson has stranded nearly 83% of his base runners (LOB%). The league average is around 71%. Career wise, Johnson owns an LOB% of 75.9. Again, there may be some regression here, but nothing too overwhelming. That said, in either case, even slight regression would raise his ERA.

As mentioned, Johnson’s HR/9 is 0.36. The league average is near 1.0. On the other hand, Johnson might not see much regression here. He has always maintained a lower than normal home run rate as evidenced in his career 0.62 HR/9. A key factor is the number of flyballs allowed, and the number that actually leave the park. We’ve talked about the value of groundballs before: More groundballs mean fewer chances for home runs to fly out of the yard. Johnson’s current groundball rate of 48.5% is nearly elite. For his career, just 7.6% of flyballs hit against him have gone for home runs. This year that number is down to 4.7%. Once more, you can expect some regression, but not much.

With a mid-90s fastball, and a slider that induces a whiff 16% of the time, there is plenty to like about Johnson. Add in the groundballs and the lack of extremely lucky batted ball data, and you have one of the best pitchers in baseball. If you already have Johnson, enjoy. If you don’t, he’s worth a big trade offer.

For more on Josh Johnson and other under the radar stars, check out Bloomberg Sports’ Fantasy Tools.