Category: Dailies
Scott Podsednik and Juan Pierre Are Black Sheep Sleepers
By R.J. Anderson
Scott Podsednik and Juan Pierre are eerily similar. The pair of early-30s outfielders share a division, an affinity for high socks and grit, past or present homes in Colorado and the south side of Chicago, and the ire of the sabermetrics community. They also own the same career OPS (.720). But it’s the two players’ ability to swipe bases which them interesting, if unheralded, options in most leagues.
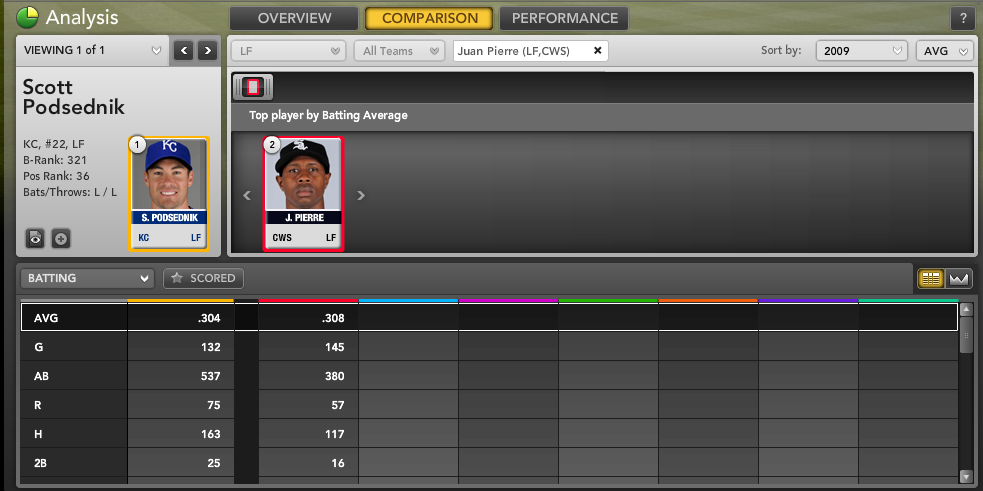
Podsednik is coming off a year in which he hit seven homers in 537 at-bats. That qualifies as a power spurt; Podsednik had hit six homers in his previous 1,407 at-bats. He also hit over .300 for the first time since 2003, his breakout season with the Brewers. Don’t expect a repeat of that feat either.
He’s still a strong stolen base threat, though, especially if he sticks in the Royals’ everyday lineup. After swiping 30 bases last year, Manager Trey Hillman has Podsednik penciled in as the starting left fielder and plans to give him the green light to run often.
Podsednik’s B-rank of 321st is accompanied by a projected line of .277, three homers, and 20 stolen bases. An average draft position of 326 suggests the market for his services is just right. With Jose Guillen shunted to DH, Podsednik winning the confidence of his manager and his speed holding up, though, 500-plus at-bats and another season of 30-plus steals could happen – which would bump up Podsednik’s value substantially.
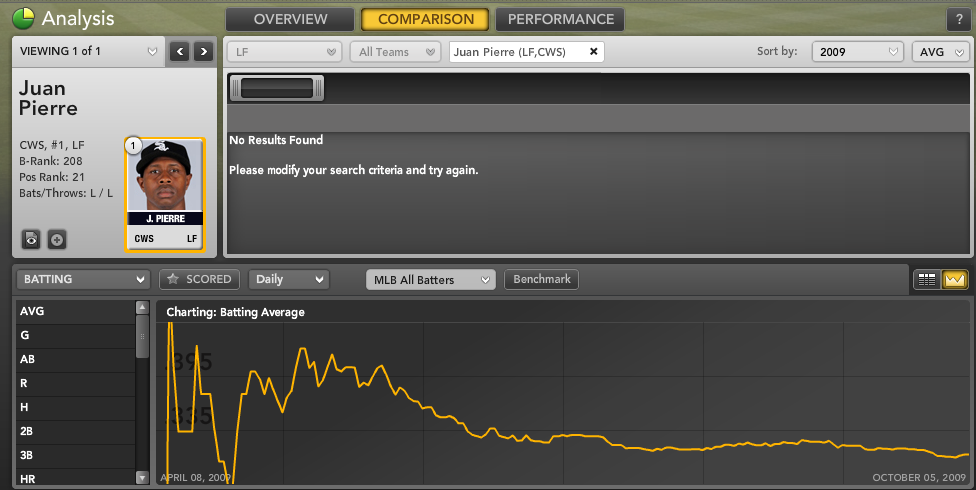
Meanwhile, Pierre will man left field on the south side of Chicago. B-Rank enjoys the faux Frenchman’s abilities far more than Podsednik’s, and ranks Pierre 208th with a projected line of .296, a single homer, and 32 steals. Considering Pierre is coming off a season in which he went on a hot streak in Manny Ramirez‘s absence, there’s a chance someone will overdraft him; in fact, his average draft position is at 196. That’s a slight overdraft, although acceptable if you draft power early and are looking for a late-round speed threat.
It’s important to note that these players are undervalued because their flaws are well-established in real world analysis. Both Podsednik and Pierre are woefully short on power, especially playing corner outfield spots, where teams typically target far more prolific offensive players. But in fantasy baseball, both could be good targets. In fact, if your fellow league members are sabermetrically savvy, Podsednik and Pierre could be terrific win-ugly value plays.
More Stolen Base Options: Julio Borbon
By Erik Hahmann
Those numbers prompted the Rangers to promote the then-23-year-old to Triple-A at the start of the 2009 season. Facing his toughest competition to date, Borbon continued to put up strong numbers, hitting .307 and getting on base at a .367 clip. Although Borbon stole only 25 bases at Triple-A, his patience at the plate showed improvement; his walk percentage climbed to 7.2%, the highest of his three minor league stops.

 The Rangers are giving Borbon every opportunity to win the center field job this spring, not wanting to run Josh Hamilton out there for a third season and risk him getting injured once more. If Borbon wins the center field job, he’ll likely lead off, which would give him an opportunity to beat Bloomberg Sports’ already optimistic projection: Getting on base in front of hitters like Hamilton, Ian Kinsler, Michael Young, and Nelson Cruz should provide Borbon ample opportunity to showcase his excellent speed and potentially even approach 100 runs scored.
Bloomberg Sports’ B-Rank projects Borbon as the 14th-best center fielder in MLB in 2010, ahead of better-known players like Nyjer Morgan, Vernon Wells, and Carlos Beltran to name a few. Those players, and others of the same ilk, might get picked ahead of Borbon in many leagues based on name recognition alone. That’s a perfect formula for landing one of the best sleeper names in fantasy baseball this season.
Will Alex Rios Rebound in 2010?
By Tommy Rancel
For the first five years of his career, Alex Rios was a productive hitter. From 2004 to 2008, he averaged .288/.338/.455 (AVG/OBP/SLG). But after a slow start in 2009, he was placed on waivers by Toronto, then given away to the White Sox for no compensation other than the amputation of his bloated contract. Overall in 2009, he hit just .247/.296/.395. His batting average was just .199 after moving to Chicago.
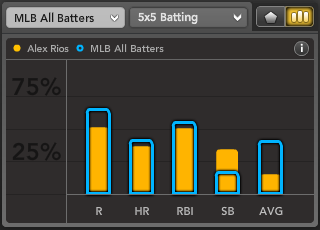
Despite the dip in those slash numbers (AVG/OBP/SLG), Rios still hit 17 home runs and stole 24 bases, providing continued value for fantasy owners.
Obviously, the most alarming loss for Rios came in batting average. In 2006-2008, his batting average was .297. His 2009 average of .247 represents a 50-point drop. For a speedy player who was only 28 years old, this was odd.
Sure enough, when we look at his batted ball data from last season — notably batting average on balls in play (BABIP) and his percentage of line drives hit (LD%) — we see some outlier numbers.
Thanks to his speed and ability to hit line drives (more on that in a minute), Rios has a slightly elevated career BABIP of .319. The league average is around .300. Last season, his BABIP dropped to .273.
Digging a little deeper, Rios has maintained a career LD% of 19.8%. In 2009, that number dropped to 16.4%.
Going even deeper into the numbers, Rios saw a tremendous drop in LD% against right-handed pitching (RHP). In his career, Rios owns a LD% against RHP of 19.8%; in 2009, that number sank to 14.7%. This is significant because Rios faced a right-hander 72% of the time last year.
Some studies, like the one here, suggest career BABIP is the best predictor of a player’s BABIP going forward. If this is the case for Rios, expect a healthy regression in batting average, and on-base percentage, towards career marks near .280 and .330.
After hitting 24 home runs in 2007, many expected Rios to become a 30/30 player; however, he is not that type of hitter. A big chunk of the balls he hits into play are line drives or groundballs (42.8% career groundball rate). This leaves little room for fly balls (37.4% career fly ball rate). Because of this, he’s averaged 19 home runs over the past three years; Bloomberg Sports projects a modest 18 homers in 2010, despite the homer-friendly climate of U.S. Cellular Field.
Meanwhile, Rios set a career-high in steals with 32 in 2008, followed by 24 more last season. Over the past three years, his success on stolen base attempts is a strong 81% (56/69). Bloomberg Sports projects 26 steals for Rios in 2010.
Although he had a down season in 2009, Rios narrowly slides into the top 100 players ranked by Bloomberg Sports; his B-Rank is exactly 100. His average draft position (ADP) is just 146.
Assuming a mid-round draft slot in an averaged size (12-14 team) mixed league, you could start your outfield with a combination like Ryan Braun, Bobby Abreu, and Rios. This trio would give you a well-rounded, durable outfield, despite using just one premium draft selection. All three players have averaged at least 620 plate appearances in the past three seasons, and provide a blend of average, (decent) power, and speed.

If we tweak the 30/30 projections on Rios down to 20/20, and add in the potential for batting average regression, we are looking at a productive third or fourth outfielder in many mixed leagues. Target him with other bounceback candidates in the middle of your draft.
For more on sleepers like Alex Rios, check out Bloomberg Sports’ fantasy kits.
Can Brian Bruney Be the New David Aardsma?
By R.J. Anderson
The Nationals’ acquisition of Brian Bruney wasn’t the most glamorous transaction of the off-season. But it could pay some serious dividends.
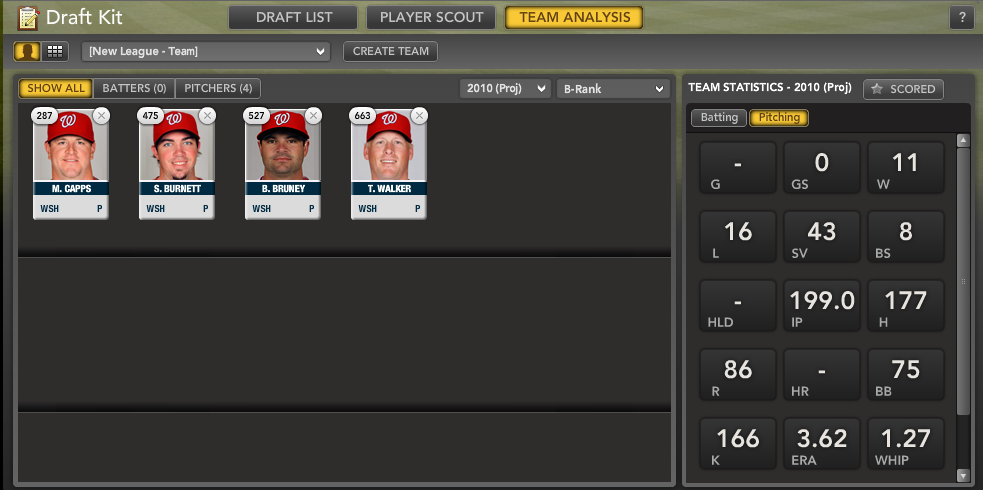
Former Pittsburgh Pirates’ closer Matt Capps figures to start the season with the 9th-inning job for the Nats. But Capps ranks among the shakiest closers in the game, following his ugly 5.80 ERA last year with more struggles in spring training. That could leave the door ajar just enough for Bruney to land some save opportunities. Bloomberg Sports projects Capps to finish with 23 saves and Bruney with 11. The realty is Bruney, who B-Rank suggests is the 33rd most valuable fantasy reliever in baseball, could find himself in the position of being the 2010 version of David Aardsma.
Last spring, Aardsma entered Mariners camp alongside a number of other relief pitching options, competing for the closer’s job. He won the job, stormed through the season, and posted a 2.52 ERA and 38 saves. Like Aardsma, Bruney has a blazing fastball that sits in the mid-90s, and a history of control problems. For his career, Bruney has averaging nearly a strikeout per inning, but with a sky-high walk rate of 6.2 batters per 9 IP. Compare those numbers to Aardsma’s career averages of 9.1 and 5.2, factor in their reliance upon flyball outs, and you can see the similarities.
Last season, Bruney struggled under the weight of a tough division, tougher park, and even tougher string of performances before the All-Star break, as his ERA ballooned to 4.86. After the break, Bruney’s luck improved and he posted a 3.22 ERA. A move from the American League East to the National League East would help anyone; Bruney is no exception.

Eight different pitchers recorded saves for the Nationals last year, including Mike MacDougal and Joel Hanrahan – two similar-profiled pitchers. All told, there were 33 saves to be had. The common concern when drafting closers on bad teams is whether they’ll receive enough opportunities to be worth the slot. This logic is sound, and seemingly supported by research. The majority of those eight relievers have moved on, leaving Bruney and also-ranks like Tyler Walker and Sean Burnett around to scrap over extra opportunities.
What you do with Bruney depends on the depth of your league. In a 10-team mixed league, even drafting the Nationals’ actual closer is iffy, let alone drafting a potential backup. But in deeper leagues, Bruney’s upside and surrounding situation in D.C. sets him apart from most others closers-in-waiting. At the very least, get him on your watch list, and be ready to pounce.
Dan Haren’s Fantasy Value: Don’t Fear the Splits
by Eno Sarris
Sometimes a player just can’t get any respect, despite consistent excellence. That might be the case with Arizona ace Dan Haren.
The good news is that over the last three years, he’s posted ERAs of 3.33 or lower, WHIPs of
1.21 or lower, microscopic walk rates of 1.8 per nine innings or lower, and a strikeout rate above 8 K/9 IP. FanGraphs’ Expected Fielding Independent Pitching stat (xFIP), which runs along a similar scale to ERA and isolates factors a pitcher can best control such as home run rate, walk rate and strikeout rate and adjusts for park effects, defense and other factors, shows Haren ranking 4th in MLB in 2009 (3.08) and 4th in 2008 (3.21). Consistency is part of Haren’s oeuvre.
Take a look at Bloomberg Sports’ Fantasy Baseball Kit and several other numbers jump out at you. Haren was better than 75% of starting pitchers in strikeouts, and also sported an elite WHIP. Toiling for the 70-92 Diamondbacks kept Haren from amassing an impressive number of wins (he settled for a still solid 14), but there’s room for hope there as well. The D-Backs’ 720 runs scored last year were average for the National League (8th out of 16) and with a few steps forward from youngsters Justin Upton and Stephen Drew, the team could add to that total – especially in a hitter-friendly park. In the end, though, those factors don’t matter all that much. If Haren nets another season with the 16th-ranked ERA, first-ranked WHIP, and sixth-ranked strikeout total in baseball, you’ll be happy.
Still, much has been made about Haren’s first half vs. second half splits; the Bloomberg Tool again shows us graphically what the naysayers are saying. You can see that Haren’s ERA rose as the season wore on in 2009. This is not a new development. Take a look at his career pre- and post-All Star splits: In 651 pre-All Star innings, Haren has a 3.08 ERA, 1.06 WHIP and a 7.45
K/9. In 575 post-All Star innings, he has 4.21 ERA, 1.32 WHIP and a
7.76 K/9. Those numbers include a mediocre career 4.58 ERA and 1.31 WHIP in August.
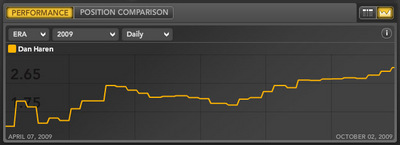 But that doesn’t mean you should draft Haren and trade him at the All Star break, or worse, pass on him entirely. The pre- and post-All-Star K rates were an early clue. But if you take ERA and WHIP out of the story and focus on underlying statistics, Haren is not really any different after the break, or even in his supposedly worst month of August.
To strip luck and other factors out of the equation, let’s return to Fielding Independent Pitching, the brainchild of baseball researcher Tom Tango. The expected version of FIP, xFIP, normalizes for home run rates given a pitcher’s ballpark and league situation. Listed on FanGraphs.com are Haren’s month-by-month xFIPs for his career: 3.82, 3.72, 3.73, 3.54, 3.37, 3.64. That’s right, over his career, Haren actually has his lowest monthly xFIP in August.
So why the ugly ‘regular’ stats? Since xFIP normalizes home run rate to a pitcher’s career average, it removes the effect of Haren’s biggest August problem – his 1.58 home runs per nine innings. His career home run rate is 1.03 home runs per 9 IP. You might argue that Haren tires late in the season and is more prone to the big fly, but there’s a fly in that ointment. Haren’s career home runs per 9 IP in September and October? 1.01. It simply doesn’t make any sense to say that Haren is tired in August but fine in September. For the more statistically inclined, there’s even a numbers-based argument against the importance of season splits like Haren’s here. Basically, they don’t exist.
But even those that don’t want to read about “r” values and other advanced statistical measures can see that it doesn’t make much sense to worry about one month. That’s doubly true when the underlying numbers don’t support the case for that one month being fundamentally worse than others.
Bloomberg Sports rates Haren as an elite starting pitcher, giving him a B-Rank of 29. That’s 5th among all starting pitchers, trailing only Tim Lincecum, Roy Halladay, CC Sabathia and Zack Greinke. Draft Haren with confidence, and don’t trade him unless you get a top-tier offer. Not even at the All Star break.
For more on why Dan Haren is good, and the horde of other starting pitchers that aren’t as good, check out Bloomberg Sports’ fantasy kit.
Keep Drafting Those Red Sox
By Jonah Keri
The hand-wringing has rung out from every corner of Red Sox Nation : How on Earth can Boston compete this year with such a weak offense?
The same way the Red Sox always have: By grinding other teams down with an unfailingly patient approach.
The
Sox ranked second in MLB last season in on-base percentage at .352
(trailing only the Yankees) and third in walks at 659 (just four behind
the Yankees’ 663 free passes). This isn’t some recent trend either.
Here are Boston’s MLB rankings in OBP and walks over the past nine
years.
| OBP | BB | |
| 2009 | 2nd | 3rd |
| 2008 | 1st | 1st |
| 2007 | 2nd | 1st |
| 2006 | 2nd | 1st |
| 2005 | 1st | 1st |
| 2004 | 1st | 3rd |
| 2003 | 1st | 3rd |
Expect the Red Sox to rank near the top of the league in those categories again this year.
First, the Sox feature four hitters who place
(http://bloombergsports.mlblogs.com/wp-content/uploads/2010/03/3-15-2010202-53-4820pm-thumb-550×275-18564813.pngarchives/2010/02/b-rank-thinks-highly-of-the-yankees-and-phillies.html)among
the top 100 in B-Rank (Bloomberg Sports’ proprietary ranking of all
players). They are: Jacoby Ellsbury (12), Kevin Youkilis (24), Dustin Pedroia (51), and David Ortiz (76).
Next, consider the off-season moves the team made.
Replacing the unholy alliance of Nick Green, Julio Lugo, Alex Gonzalez and Jed Lowrie at shortstop is Marco Scutaro.
For years a patient hitter, Scutaro enjoyed a career year in Toronto in
’09, drawing 90 walks and posting a .372 OBP out of the lead-off spot;
even assuming some regression, that’s a huge upgrade compared to last
year’s gruesome foursome.
The other two swaps do pose some risk: Jason Bay (.384 OBP) and Mike Lowell (.337 OBP) are out, Mike Cameron (.342 OBP) and Adrian Beltre
(.304 OBP) are in. Even those two moves will likely pan out better than
they look on paper. Beltre’s coming off an injury-plagued season, and
he’s moving from Safeco Field (one of the toughest parks for
right-handed hitters in the majors) to Fenway Park (one of the
friendliest for righties, especially righties with doubles power or
better). Beltre’s also five years younger than Lowell, giving the Red
Sox reason to hope for a rebound. The Sox will surely miss Bay’s
offense; but Cameron has posted strong walk totals every season,
including 75 last year. He won’t be the big power threat that Bay was,
but he’ll do his part to turn the lineup over.
Meanwhile, Boston’s offense could benefit from two other factors this
season: A bounceback season for Ortiz (a miserable first half held him
to a mediocre .238/.332/.462 mark in ’09) and a full year of Victor Martinez (.303/.381/.480 in ’09) at catcher, replacing the rapidly declining Jason Varitek.
Here’s what the Red Sox lineup should look like come Opening Day:
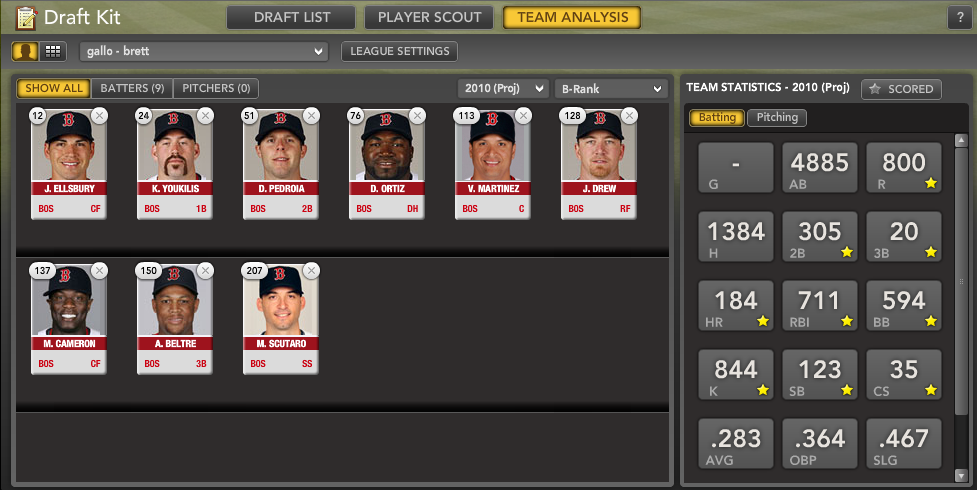
Note the composite projections for that lineup: .283/.364/.467 (AVG/OBP/SLG). Those numbers would rival any team in baseball if they come to fruition.
Skeptics remain concerned that the Sox might lack the kind of major
power threat that typified recent Boston teams: Bay last year, Ortiz
and Manny Ramirez in the past. But in a game with no clock,
where the proceedings only end after 27 (or more) outs, the single most
important skill a baseball team’s offense can possess in baseball is
the ability to avoid those outs.
That’s largely true in fantasy baseball too. There’s a good chance your
league doesn’t count walks and on-base percentage. But as long as Red
Sox hitters keep vying for the league lead in both categories, they’ll
score a lot of runs. That means plenty of counting stats for most any
Boston hitter you draft.
For more information on all of the Red Sox, and hundreds of other
players, and for dozens of tools to help you dominate your fantasy
league, check out Bloomberg Sports’ fantasy kits.
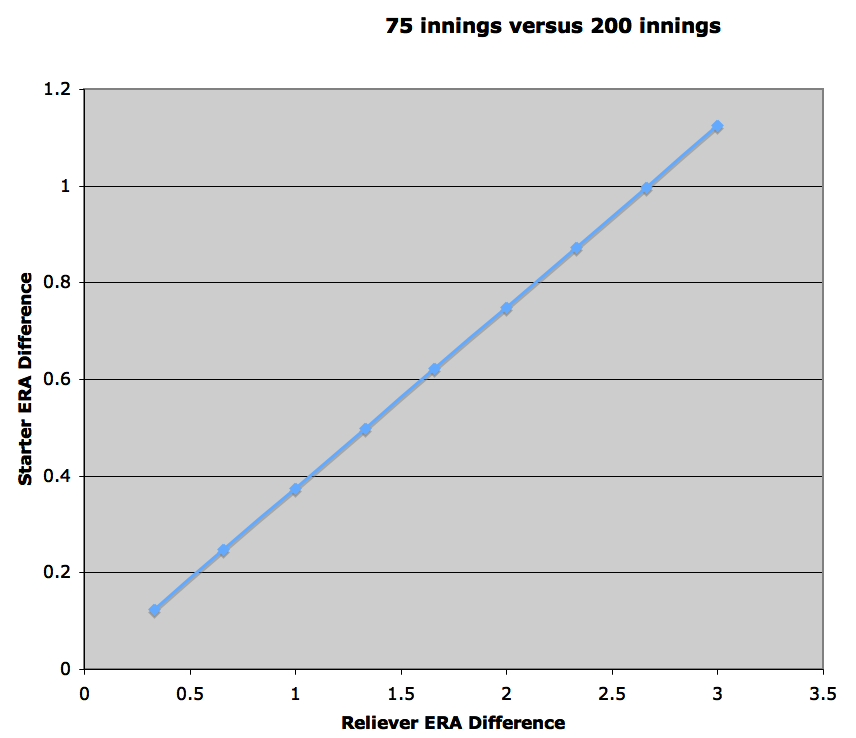
True Value of Great Relievers, Part 1
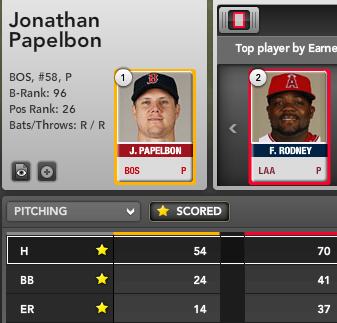
As you’ll see above, Papelbon saved 23 runs and 33 H+BB over Rodney.
Bobby Abreu Remains A Sleeper In 2010
By Tommy Rancel
Despite playing most of his career in major media markets (Philadelphia, New York, and Los Angeles), Bobby Abreu remains one of baseball’s most underrated players.
Since 2001, Abreu has averaged .295/.400/.485 (AVG/OBP/SLG), 21 home
runs, 102 RBIs, 106 runs scored and 30 steals. In eight of those nine
seasons – including 2009 – he topped 100 RBI.
Last season Abreu took his bat west to Los Angeles. The change
in time zone didn’t change his production much. In his first season for the
Angels he hit .285/.390/.435 with 15 home runs and 103 RBI. He also scored 96 times and swiped 30 bases.
Abreu’s all-inclusive skill set has avoided most signs of
age-related
decline. Though he’s not the fastest runner in the game, he still
racks up plenty of steals. His
career 22.8% line drive rate (LD%) keeps his batting average
consistently above .280. His trained batting eye – shown by a 14.9%
career
walk rate – allows his on-base percentage to hover around .400. The
only element that’s held him back from true superstar status is his
good-but-not-great power.

Still, Abreu does carry some concerns heading into 2010.
First, he turned 36 this week. For most players, this would be a
giant red
flag. But Abreu profiles differently than most aging players, with a
high-contact swing and good speed to go with walks and gap power. On the other hand, that power appears to be waning: Abreu’s 15 homers and .142
isolated slugging (slugging percentage minus batting average) were both
his lowest figures for any full season.
Over the past three seasons, Abreu’s batting average on balls in
play (BABIP) is .338. This would be high for a normal player with a
league average near .300 BABIP. For Abreu, a .338 BABIP is nearly 10
points lower than his .347 career mark. The high BABIP is a product of
his career 22.8% line drive percentage. Even if he regresses further toward .300, his
batting average will likely remain playable.
Many will point to the departures of Chone Figgins and Vladimir Guerrero as additional causes for concerned. Guerrero was already on the downswing of this career, and he’ll be replaced by Hideki Matsui at
designated hitter; Matsui’s 2009 OPS of
.876 was 82 points higher than Guerrero’s .794. But Figgins’ 100-walk,
.400 OBP ability will be nearly impossible to replace. The Angels will
hope to do it by committee, relying more on
younger players like Howie Kendrick, Erick Aybar, and Brandon Wood. Those three players, along with Mike Napoli, Juan Rivera, Torii Hunter and 2009 breakout Kendry Morales, should continue to offer the kind of support that leads to solid counting stats.

B-Rank loves Bobby Abreu with a ranking of 30; however, his
average draft position is a low 100.2. Even if you move Abreu’s value
down a bit to account for age and Figgins’ departure, you’re still
looking at big value potential around the seventh round in 12-team
mixed leagues or the eighth round in 10-team mixed leagues.
Looking at players with similar production to Abreu last year, Nick Markakis
is a pretty close comparison. In 2009, Markakis hit .293/.347/.453 with
18 home runs, 101 RBI and 94 runs scored. Markakis wins the slugging
battle .453 to .435, but Abreu was on base at a much higher clip (.390
to .347). The big difference came in steals: Mid-30s Abreu stole 30 bases, compared to mid-20s Markakis’ total of just
six.
Markakis places 59th in B-Rank with an ADP of 54.2. While it’s
usually a good idea to discount older players and bump up players
entering their physical prime, Abreu still projects to produce similar,
or possibly better numbers than Markakis in 2010 – yet he’s being
drafted 46 spots behind his Orioles counterpart.
As long as there are no major health concerns with an older player,
that’s often a great place to find value in your draft. Abreu’s career
low in games played since his first season as a regular is 151; he’s
been a model of durability for the past 12 years. If he falls in your
draft, pick him up.
For more on Bobby Abreu, and hundreds of other players, check out Bloomberg Sports’ fantasy kits.
Kendry Morales: Fantasy Value or Sophomore Bust?
By Eno Sarris
At the start of last season, the Angels had a vacuum at first base after Mark Teixeira chose pinstriped dollars and headed East.
Enter Cuban import Kendry Morales. Morales had totaled 1,130 at-bats at the Double-A level or above, showing the
Angels he was at least ready to provide league-average offense at
first base, with a nice glove. The Angels previously let light-hitting Casey Kotchman man first base – Morales couldn’t be much worse, could he?
Many fantasy players were caught off-guard when Morales zoomed right by
average. Here was a player that once hit five home runs in a full year
(2007 in Triple-A Salt Lake, a park that usually inflates home runs by 10%
or more in a given year). He wasn’t supposed to come up and mash
.306/.355/.569 (AVG/OBP/SLG) in his first full MLB season. That slugging percentage
was even better  than the minor league number (.528) he put up in much more favorable hitter’s parks, even better than the best number he put up at any one stop along the way.
This season, the first-base position is deep for fantasy baseball purposes. Managers can afford to wait before grabbing a first baseman, especially if someone like Morales (B-Rank 43) is
slipping below his average draft position (61.3 ADP). Let’s say he won’t drop further than the fifth or sixth round, though. Do you pull the trigger? Will he hit for the same power and batting average this year?
Let’s take the easier question first. Morales hit .306 last year, but sported a .329 batting average on balls in play (BABIP). If that BABIP regresses towards the league-wide average (around .300), he should sport a lower batting average, correct? Not so fast. While BABIP figures across baseball hover close to .300, each player has some control over that number, especially if he possesses unique speed and hitting ability. Consider that Ichiro Suzuki has a lifetime BABIP of .357, for instance. Luckily for us, baseball analysts Peter Bendix and Chris Dutton developed a simple calculator for Expected BABIP (xBABIP); if you plug in Morales’ component statistics, you get .320. So while there might be a little regression in his stats, but it looks like this career .332 hitter in the minors stands a good chance of posting a batting average around .300 next year.
Now the harder question. What will his power output look like? it’s an open question for sure, since Morales had a slugging percentage closer to .400 in his first couple of attempts at the major leagues, then zoomed right by that figure, and .500, last year. Look at his monthly slugging percentage and you’ll see that it took him half of last year to get there. Will he see a summer surge that big again?
One good sign for Morales’ power potential is his minor league Isolated Slugging number (ISO, which is Slugging Percentage minus Batting Average). Even granting the homer-friendly parks he played in, Morales hovers around a .200 throughout his minor league career, a good sign. Major leaguers who posted an ISO around that number last year included Torii Hunter, Curtis Granderson, Matt Holliday and Robinson Cano. These are useful comps: Many of these players might hit 30 home runs, but would you bet your house on it? Bloomberg Sports is bullish on Morales and projects 32 homers. Still, there’s always the potential for regression to the mean after such a huge breakout season.
Morales could be a good acquisition if you can get him late enough in the draft. But considering that his power might skew closer to Robinson Cano than Prince Fielder, an early-round pick might be a bit of a reach.
For more information on Kendry Morales and other draft options, and more, check out Bloomberg Sports’ fantasy kit.
The (Always) Underrated Torii Hunter
fantasy baseball, we’re always looking for the player who can provide
all-around value. To most people, this means a guy with both power and
speed. Every year, we’ll see about a dozen guys crack 20/20. Last year,
there were 14 of them.
 When
When
projecting Hunter’s 2010 season, there’s another consideration
to make. Besides having the rare ability to provide speed and the
opportunity to knock in runs, Hunter is one of only about 20 players in
baseball with 25-HR power and the ability to make contact with the ball
in at least 80 percent of his at-bats. Combined with the ability to run
quickly to first base after the ball is hit into play, this typically
translates to a pretty solid average. Last year, Hunter finished at
.299. Bloomberg Sports projects .289 for the upcoming season.
ranked 46th on the B-Rank scale, yet is being drafted well below his
projections. That’s nothing new. Hunter has a pretty long history of
being underrated in drafts year after year, and at age 34, few see him
as having the kind of statistical upside offered by many youngsters.
But is that assessment accurate? A player who provides power, speed,
RBI production, and average? Those kinds of players are a very rare
breed. Just ask Pujols, Hanley, and Braun.
