Category: Dailies
Should You Sit Your Starting Pitchers in Week 1?
By Eriq Gardner
A reader wrote in to ask whether or not the numbers support sitting a starter in the first week of the season.
I understand the reasoning behind the strategy: In the first week of the season, starters might be dangerous, as they haven’t built up the stamina to go long into games, may not have fully gotten control of their arsenal of pitches, and might be expected to be less likely to put up wins and more likely to damage a fantasy teams pitching ratios.
But let’s look at the numbers.
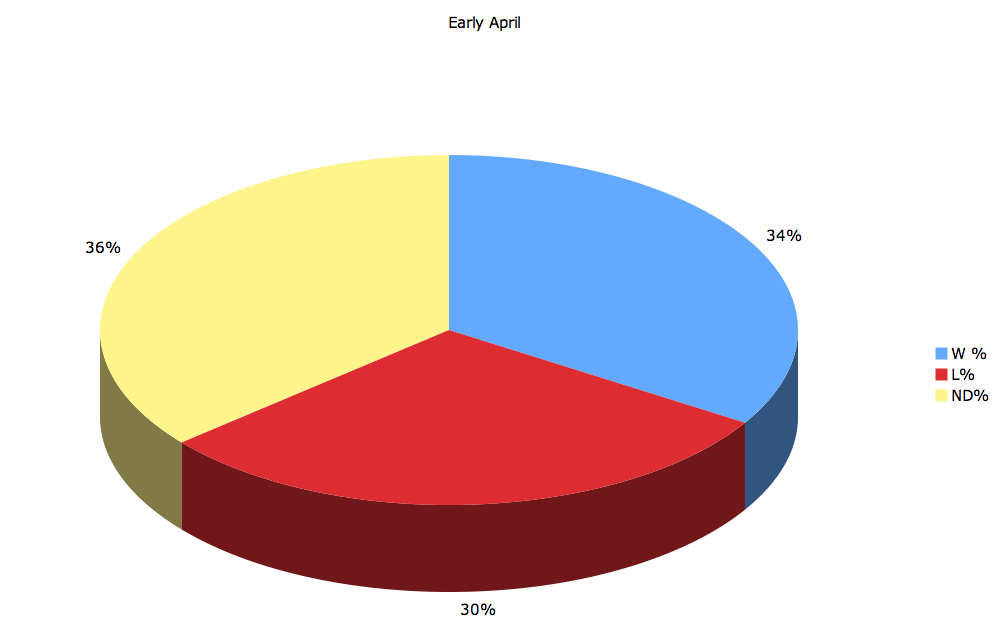
Unfortunately, we couldn’t find any “first week” splits anywhere, but we were able to gather together data for pitchers who made starts between April 5 and April 12 going back five years. We can call this set of data, “Starters in Early April,” which may be better anyway since what we’re talking about is a pitcher’s seasonal maturity at this early part of the year. We compared these data to how starters performed overall in the past five years.
The results of the study were somewhat surprising.
Let’s start with endurance and the potential for wins. We’re shocked to learn there’s hardly any difference at all. Starters in early April average 5.8 innings per game started. Starters average the same 5.8 innings per game started throughout the season. In early April, starters win the games they start 34% of the time. Throughout the season, that only ticks up to 35%. In early April, starters are a little less likely to be on the hook for a loss and a little more likely to be given a no-decision, but unless your league counts those stats, that’s not very important.
Let’s go to ERA and WHIP.
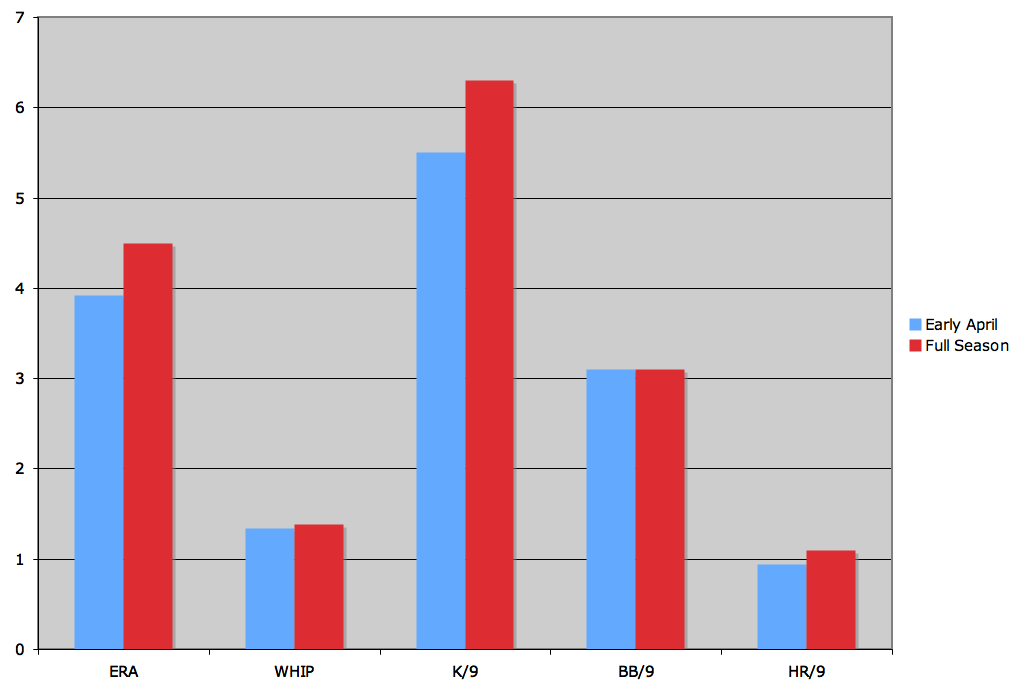
Here we find big differences, but in the complete opposite direction we expected. Starters in early April average a 3.92 ERA and a 1.34 WHIP. Over a full season, starters average a much worse 4.50 ERA and a 1.39 WHIP. Is it because teams mostly have their best starters healthy at the onset of the season? Perhaps that’s one factor, but I think we can explain the difference better by jumping into the peripheral numbers.
First, we find no command issues. Both time frames yield an average of 3.1 walks per 9 IP.
Interestingly, despite the better surface ratios, pitchers at the beginning of the season strike out fewer batters. In early April, pitchers strike out 5.5 batters per 9 IP. Throughout the season, the number jumps to 6.3. If starters are whiffing fewer batters in early April, how are they managing to gain a better ERA?
We can put the mystery to bed by taking a look at the HR numbers. In early April, the HR/9 rate of a starter is only 0.94. Throughout the season, it’s 1.1. Clearly, the biggest advantage that a starter has at the start of the season is the colder weather. If you’ve ever swung a bat in frigid temperatures, you know it stings upon contact. Moreover, because warm air is less dense than cool air — ask your local meteorologist — balls travel further in those warm summer months.
So while it might seem a good idea to bench your starters early in the season, the numbers say you should do no such thing.
For more on starting pitchers, check out Bloomberg Sports’ fantasy kits
The Bloomberg Sports Fantasy Squad
By Jonah Keri
It’s one
thing to dig into the numbers and make a bunch of predictions for the
upcoming fantasy season. It’s quite another to put your fantasy draft
where your mouth is. That’s just what I did last week in the Brian Kenny Show Fantasy Baseball League.
Run by ESPN anchor and radio host Brian Kenny, the league
includes some heavy hitters at the Worldwide Leader, along with a special guest from the pigskin world. Mike Greenberg (of the Mike and Mike Show), Linda
Cohn, Jay Harris, Ryen Russillo, Amy Lawrence, Buster Olney, Rob Neyer
and NFL wide receiver T.J. Houshmanzadeh (I was as surprised as you, but the man’s got a good team) joined me in the league, along
with Kenny, his producer Mike Urrunaga, and three listeners.
The format is a little different than your typical fantasy league.
Instead of the standard 5×5 format, or the original 4×4, this is 6×6.
The offensive categories are: HR, RBI, R, SB, along with OBP and SLG
(no Batting Average). The pitching categories are: W, K, ERA, WHIP,
along with Quality Starts and Saves+Holds (instead of Saves only).
The strategy here was simple: Load up on offense early and grab
quality starting pitching periodically. Then take advantage of the
league’s unique categories in two ways: 1) Punt saves, so that while
others are fixated on lousy closers, I can swoop and take elite set-up
men who’ll produce almost as many holds, with much better ratios. 2)
Target hitters late in the draft who are better in real life than in
fantasy, since they typically put up low batting averages but also
strong on-base percentages and slugging averages.
Picking 10th in the draft, I grabbed Rays third baseman Evan Longoria
with my 1st-round pick. I wanted big power numbers right away, since
cheap steals figured to be abundant. Third base is also a thin position
this year, Alex Rodriguez was gone, and I trusted Longoria’s improving game and stacked Rays lineup over David Wright, the 10 home runs he hit last year, and his abysmal Mets teammates.
I was hoping to address position scarcity again and grab Rockies shortstop Troy Tulowitzki with my 2nd-round pick, but he went four slots ahead of my #19 selection. Come on down Roy Halladay! The Phillies’ new ace is the most dependable starting pitcher in the game, ranked #2 behind only Tim Lincecum
this season and #14 in B-Rank (Bloomberg Sports’ proprietary ranking of
all MLB players). The initial goal might have been to target offense
early, but you don’t say no to Halladay at this point of the draft.
That Quality Starts were an additional category in this league only
made Halladay (and other top SP) more valuable.
The next four rounds were an offensive blitz. Padres first baseman Adrian Gonzalez
is already an elite hitter in standard leagues; add OBP and SLG to the
mix, though, and he’s arguably a top-10 hitter. So heck yes, I’ll take
him at #38. With Longoria and Gonzalez now anchoring the infield and
the power categories, it was time to look for speed, which is copious
this year in the outfield. Kenny was hosting his radio show as the
draft was going on, and had no qualms about calling out players he
wanted. In Round 4, he was jonesing for Rays outfielder B.J. Upton.
At #47, I was already planning to take Upton if he fell to me; huge
source of steals, and now that he’s reportedly over the shoulder injury
that plagued him in 2009, I expect big bouncebacks in OBP, SLG and
counting stats. Taking Upton three spots ahead of Kenny, and eliciting
a horrified on-air reaction, only made the pick sweeter.
For my fifth-round pick, I turned to the first of several Bloomberg
Sports Blog-profiled players I would nab in this draft: newly-minted
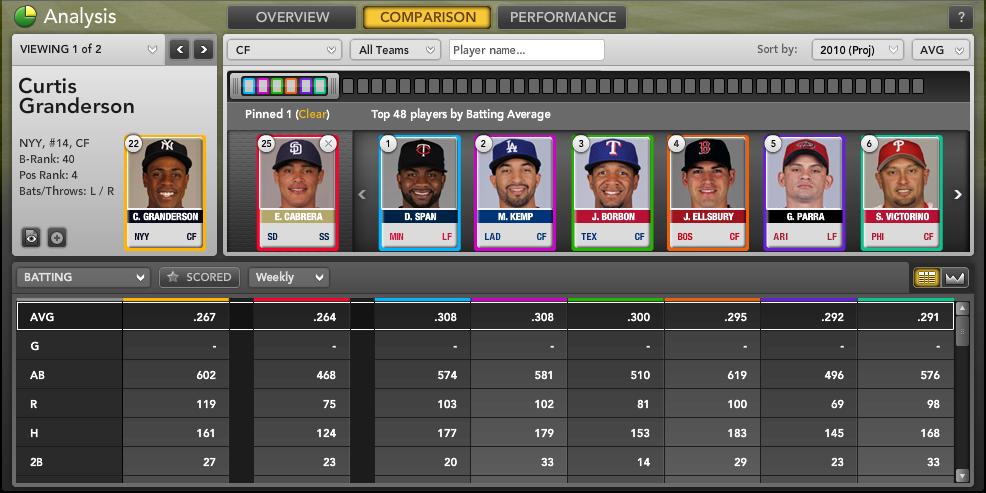
Yankees outfielder Curtis Granderson. Here again I wanted a power-speed guy and agreed with the take of colleague Tommy Rancel, who profiled Granderson as a
30-home run player coming to Yankee Stadium, a place that greatly
favors slashing left-handed hitters. Much later in the draft (16th
round), I would grab Padres shortstop Everth Cabrera, adding more speed to the roster, and a second Bloomberg Sports Blog-touted option for 2010.
With the five-outfielder format of this league, I wanted another power-speed OF early, so Rangers outfielder Nelson Cruz (33 HR, 20 SB, .524 SLG in his first full season last year) made it three such picks in a row, at #75.
Then, the pitching onslaught began. In recent weeks, we’ve discussed the huge upside of Marlins starter Ricky Nolasco and Rockies starter Ubaldo Jimenez (as well as his slightly less talented but still solid teammate Jorge de la Rosa).
I landed all three of those pitchers, in the 7th, 8th, and 15th rounds
respectively. All three project to put up big strikeout numbers, with
Nolasco and Jimenez also targets to produce stellar ratios and even
darkhorse Cy Young seasons.

In the later rounds, I drafted a
boatload of players who figure to benefit from the league’s OBP/SLG
yes, AVG no format, including Yankees outfielder/first baseman Nick Swisher, Nationals outfielder Josh Willingham and Angels catcher Mike Napoli. Brewers second baseman Rickie Weeks
is a definite injury risk, but his power/speed/OBP potential made him
too good to pass up in Round 11 (and I hedged by grabbing Twins second
baseman Orlando Hudson in post-draft free agency as a backup).
Rounding out the draft, I landed no fewer than four top set-up men
who figure to combine for 100+ holds plus occasional saves, all four
with strong strikeout and ratio numbers. Good to have you, Matt Thornton, Daniel Bard, George Sherrill and Mark Lowe. You’ll be a lot easier to carry all season than shaky Opening Day closers like Matt Capps and (shudder) Matt Lindstrom.
I’ve pasted the roster for the Bloomberg Sports Squad below. We like our chances. (Round selected in parentheses)
You can follow the league, all season long, here.
HITTERS
C Mike Napoli (13th)
1B Adrian Gonzalez (3rd)
2B Rickie Weeks (11th)
3B Evan Longoria (1st)
SS Everth Cabrera (16th)
MI Marco Scutaro (18th)
CI Nick Swisher (14th)
OF B. J. Upton (4th)
OF Curtis Granderson (5th)
OF Nelson Cruz (6th)
OF Denard Span (10th)
OF Josh Willingham (20th)
UT Paul Konerko (17th)
PITCHERS
SP Roy Halladay (2nd)
SP Ricky Nolasco (7th)
SP Ubaldo Jimenez (8th)
SP Brett Anderson (9th)
SP Max Scherzer (12th)
SP Jorge de la Rosa (15th)
SP Ervin Santana (22nd)
RP Matt Thornton (19th)
RP Daniel Bard (21st)
BENCH
RP George Sherrill
RP Mark Lowe
2B Orlando Hudson
1B Russell Branyan (DL)
Alex Gordon: Post-hype Sleeper or Bust?
by Eno Sarris
Think back to 2006. That quaint comedy Beerfest was taking the country by storm while we were all saying prayers for Barbaro’s quick recovery. Faint memories of a movie called Little Miss Sunshine waft through the house like the scent of apple cobbler. Ah, those were the days.
Those were also the last days that featured Alex Gordon as The Future of the Royals Franchise. He was tearing up the minor leagues at the time, a number-two pick overall making good on his promise with a stellar .325/.427/.588 (AVG/OBP/SLG) line in Double-A. Fans of the powde -blue were practically salivating at the thought of the new George Brett rescuing the franchise. Gordon was the epitome of the hyped prospect and was being penciled in for the 2007 Rookie of the Year hardware before the season began.
Unfortunately this story was not going to be without some speed bumps. Gordon produced an underwhelming .247/.314/.411 major league stat line in 2007. Though he played a decent third base and was actually an above-average player when appraised as a whole, the hype balloon was popped. If his second season’s line, .260/.351/.432, was also not very inspiring, and last season his year was cut short by an injury, why is there hope for Gordon to have a good year this season? He’s currently hurt – could his stock fall any lower? Take a look at the graphical representation of his 2009 compared to other major league batters in the Bloomberg Sports Fantasy Kit. Yuck.
Taking
a player on the hopes of a rags-to-riches journey is always enticing for a fantasy player
looking for value. Consider that Gordon actually showed some signs of
life between his first two years, and you’ll find that his 189-plate appearance season in 2009 is not enough to write those gains
off. If you instead focus on his first two years, here’s a short list
of underlying statistics that Gordon improved in his sneaky-good
sophomore season: walk rate, strikeout rate, isolated power, line drive
percentage, fly ball percentage, home runs per fly ball, reach rate,
and contact percentage.
That’s a lot of improvement. In other
words, Gordon walked more, struck out less, reached at fewer balls outside the strike zone, and hit the
ball higher, further and harder. Isn’t that the kind of improvement you want from your best prospect? There’s reason for a bit of concern after last season, and Gordon’s health needs to be watched. Still, there’s reason for hope too.
Looking at his minor league
numbers and you might still expect super-stardom from Gordon, but there is
a slight asterisk that must come into play. As an accomplished college
star, Gordon hit Double-A at 22 years old (the average age of his league that year was 24).
Age matters when considering a player’s statistics in the minor leagues
– if a teenager is holding his own against top talent (like Elvis Andrus, who was 19 in the same league in 2008, or Jason Heyward
hitting the majors at 19), he gets extra credit. If a guy in his
mid-20s comes in and destroys younger pitching, his stats lose a
tiny bit of luster. Have some fun and check Kevin Maas‘ minor league statistics and the picture becomes clearer.
In
any case, the positives here still outweigh the negatives, as nebulous
as Gordon’s future may seem. Gordon has a good bit of power, a little
bit of speed, plays an important position, and has an improving
approach at the plate. The ending of this movie has not yet been
written, and it may just yet be the story of a Post-Hype Sleeper that
made good.
For more information on Alex Gordon and other cheap third-sackers this year, check out Bloomberg Sports’ Fantasy Kit for yourself.
Ricky Nolasco’s ’09, Bad Luck or Bad Form?
Going into last season, Ricky Nolasco‘s solid rookie campaign pointed to a budding star poised to make a large fantasy impact. He finished the year with a solid 13-9 record for a decent Florida Marlins club, but also put up a disappointing 5.06 ERA — a full run and a half higher than his previous season.
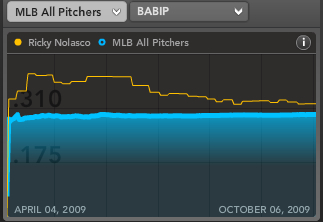
Some might see Nolasco’s extremely large jump in BABIP from .284 in 2008 to .336 in 2009 and his impressive FIP (Fielding Independent Pitching – a measure that runs on a similar scale to ERA but strips out factors such as defense, run and bullpen support) of 3.35 for the year as signs of a particularly unlucky season and thus expect regression to the mean this year. But there’s more to it than that. The key is to look at the splits.
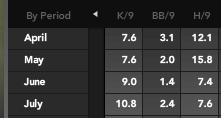
The disparity between his April/May and June/July splits is quite astonishing. Nolasco posted a huge 6.49 FIP in May coupled with an absurd BABIP of .418 and a left-on-base percentage of 37.6%. This means that 62.4% of batters that reached base against Nolasco ended up scoring! Compare this with one month later, when all of those stats fell faster than stock in Toyota. In June and July, Nolasco saw his BABIP fall to around .300 and his LOB% rise to a solid 75%. His FIP fell below 3.00. So what happened? We know that he was not injured, so the answer must have involved his mechanics.
Whatever it was did not seem to affect Nolasco’s ability to hit the strike zone. Bloomberg Sports’ performance grid shows that his walks per nine innings (BB/9) stayed right around his career average. Instead, it appears the culprit was an inability to keep the ball down in the zone, as evidenced by his flyball percentage (FB%), which jumped to 50%, from his usual average of about 41%. Needless to say, this is a big problem for a major league pitcher, especially one that depends on a dominant slider as one of his go to pitches.
If a slider is thrown properly it should have significant lateral movement as well as diving action, causing hitters to swing over top of the ball and drive it into the ground, or miss it completely. However, delivery issues could significantly hinder a pitcher’s ability to achieve this breaking action. When thrown poorly a slider will stay flat and be easily distinguished by the hitter, (as explained in detail here) which is what appears to have happened to Nolasco.
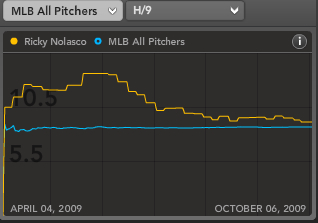
The increased FB% and a drop of two strikeouts per nine innings, to 7 from 9, indicates that batters were able to square up his pitches far more often then normal. Instead of hitters rolling over his breaking stuff and driving it into the ground, they were able to make more solid contact — and Nolasco struggled as a result. The Bloomberg Sports hits per nine innings chart (H/9) shows just how bad it got for him. At one point he was giving up five more hits than the league average. The H/9 chart also shows a strong correlation with the BABIP chart. This is a clear indication that what many thought was a run of bad luck, was also the result of bad pitching.
On May 22, Nolasco was sent down to Triple-A to work out his issues, and whatever adjustments were made worked out well. After he returned on June 7, Nolasco saw a return to his old results. His flyball rates fell in both June and July, bottoming out at 24.1%, his groundball rate skyrocketed to 54.2%, and his K/9 returned to its normal rate of better than 9.0. During this time Nolasco achieved a miniscule 2.34 FIP.
In 2010 it won’t be better luck, or better fielding that enables Ricky Nolasco to return to the mean, and the hearts of fantasy managers. Look to see if he can become more consistent in his delivery. If he can do this, he will make a very solid number two starting pitcher for any fantasy team.
Some Things to Consider When Measuring Player Value


James Shields: Rays’ Quiet and Consistent Ace
By R.J. Anderson
Here’s a fun trivia question: Who has the fourth-most innings pitched over the past three seasons, behind only Roy Halladay, CC Sabathia, and Dan Haren? Nope, not Cliff Lee or Felix Hernandez. Nor Justin Verlander.
It’s James Shields. The Tampa Bay Rays ace has made at least 31 starts in each of his three full major league seasons while completing at least 215 innings, and winning at least 11 games. Shields’ durability would be one thing, but when combined with solid performances — notably by advanced metrics, like Fielding Independent Pitching or even Adjusted Fielding Independent Pitching (both of which attempt to strip the luck aspect out of evaluating pitchers) — Shields becomes one of the better and more underappreciated talents in the league.

Oddly enough, Shields is actually being drafted well ahead of his 133 B-Rank; his ADP is currently 110. His 2010 Bloomberg Sports projection calls for 217 innings, a 3.89 ERA, 13 wins, and a 1.23 WHIP. That line places him smack in the middle of strong three-star pitchers such as A.J. Burnett, Brett Anderson, and Rays teammate Matt Garza.

Shields has the luxury of pitching in front of one of the best defensive teams in baseball, which should help his rate stats. One thing Shields does, perhaps better than anyone else in the division, is mix his pitches. When he came into the league, he was extremely reliant upon a plus change-up. Talk to a handful of scouts during that period and his change-up was right up there with Johan Santana’s for the honor of best in baseball. Since then, though, Shields has continued to add pitches and tweak his arsenal. He throws a cutter now and has a plus curve to go with it. He locates all of those pitches well.
The only real flaws in Shields’ game is the lack of run support (presumably something that should even out over time), and home runs allowed. Shields’ run support was just 4.42 runs per game last season, despite the Rays’ offense setting numerous
franchise records for offensive production; that was the fourth-lowest total among AL starters. Meanwhile, Shields has allowed at least one home run per
nine innings in each of his big league seasons. Last year’s 1.19 HR/9 IP was a
career high in seasons where he threw more than 150 innings, so expect
a little regression there.
Still, the positives far outweigh the negatives. The Rays’ franchise single-season record for wins by a pitcher is 14. With a little help, Shields could break that record this season, and could do so as a strong number-two or number-three option on your pitching staff.
For more on James Shields and other starting pitchers, check out Bloomberg Sports’ fantasy kits.
Stephen Drew: Post-Hype Sleeper or Bust?
by Eno Sarris
We continue our way around the infield after examining the post-hype prognoses for Chris Davis and Rickie Weeks. It’s about time that I admit my dark secret – I actually own a fantasy team that features all of these players around the horn on the infield. As I joked on this podcast with the folks at BaseballPress, this is not a strategy to try at home, and it’s only the particulars of this league that forced me into a corner. On the other hand, finding an undervalued player that has shown elite skills in the past for a bargain price is useful in any league.
So does Stephen Drew count? He has certainly shown plenty of strong attributes at the plate – but not in the same season. If he puts these disparate parts of his game together, though, he could become an impact player at shortstop. It’s been shown by researcher Tom Tango that a player’s peak age range is 27 through 29. Lo and behold, Drew is 27. Could this be his year?
 There’s a bit of a split between Bloomberg Sports’ projections for Drew and the wisdom of the crowd on this one. The Bloomberg Sports Fantasy Kit projects Drew for an underwhelming .268 batting average, albeit with 18 home runs. Shown graphically to the left, these numbers don’t combine to instill confidence. In what is perhaps a nod to the fact that manager A.J. Hinch is thinking of batting Drew second this year, he is projected for a decent 80 runs. Are those runs scored combined with the poor batting average and mediocre home run total enough to make fantasy owners right for drafting him more than 100 spots earlier than his B-Rank (B-Rank 229, ADP 127.6)?
There’s obviously some value in his complete package of skills. His skills looks better on a Bloomberg Sports spider graph, where you can see how he stacks up in the offensively-challenged position of shortstop. Even that graph might be selling Drew short, though.
Take his batting average. Not only has he hit .291 before (in 2008), but he’s shown the different components of being able to do it again. Check out his reach rates (the percentage of swings at pitches outside of the zone) since he hit the majors: 30.6%, 21.8%, 28.2%, 22.3%. It may not be a surprise that his walk rate has oscillated similarly: 6.2%, 9.7%, 6.2%, 8.2%. On the plus side, one element of his game has steadily improved: His contact rate has risen from a poor 74.3% to a solid 84.2%.
What does it all mean for his batting average? it means that Drew is struggling with his aggressiveness but is making more and more contact as he figures it out. The recipe for a good year might just include a nice middle ground for his reach rate (say around 25%), an average walk rate (last year the ML average was 8.9%) and an above-average contact rate (the ML average was 80.5% last year). He’s done each piece before – it follows that he could hit each benchmark again, ideally in the same season.
Because he’s not a speedster (19 career stolen bases), the power is the other attractive part of Drew’s profile. His isolated power (slugging percentage minus batting average) has also jumped around more than Ozzie Guillen after a liter of Red Bull: .201, .133, .211, .167 (ML average is usually around .155). This is probably related to another component stat that Drew is struggling to harness: his line drive percentage (23.8%, 16.5%, 22.6%, 18.9%). It seems that his power rises and falls with his line drives. The lesson here is that he’s had nice line drive rates twice before – he can do it again.
Why would this year be the year that he once again puts together a good line drive rate with a strong approach at the plate and gives us something that looks like 2008 (or better)? Well, spring training stats are obviously a small sample size, but sometimes those mere 40 or 50 at-bats can give us hope. It is also worth mentioning that John Dewan has shown that about 75% of players that improve their slugging percentage by more than .200 in spring training go on to perform better than their career average during the upcoming season. Drew’s close. His slugging percentage this spring? .609. His career number? .445.
For more information on Stephen Drew and his fellow shortstops this year, check out Bloomberg Sports’ Fantasy Kit for yourself.
Is Tommy Hanson the Next Great Atlanta Braves Pitcher?
By Tommy Rancel
Stephen Strasburg is the top pitching prospect in baseball, but he may not even be the most important young pitcher in his own division. Tommy Hanson of the Atlanta Braves is not only a major league starter right now; he’s also poised to become one of the National League’s best starting pitchers.
Even in his own backyard, Hanson plays second fiddle. Braves outfielder Jason Heyward is generally regarded as the top prospect in baseball. In addition to the top ranking, Heyward has been the most talked about player this March, highlighted by a windshield-shattering home run display.
Strasburg and Heyward have the hype, but Hanson is the only one with major league experience, and major league success.
In 2009, the 23-year-old right-hander won 11 games in his first 21 major league starts. According to baseball-reference.com, only 22 players (classified as first-year players, not necessarily rookies) other than Hanson won 11 games in their first 21 starts with a sub-2.90 ERA since 1901. Hanson posted a 2.89 ERA and 116 strikeouts in 127.2 innings.
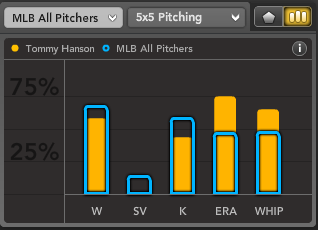
Despite his young age, Hanson showed control usually found in a veteran starter. He struck out nearly a batter per inning (8.18 K/9) while keeping his walks at a manageable 3.24 per nine innings (BB/9). Hanson excelled at missing bats, with a swinging strike percentage near 10% (9.9%) and a contact rate (percentage of swings against that are put in play, including foul balls) of 77.2%.
Hanson has a good fastball that runs around 92 miles per hour. His secondary pitches–curve ball and slider–are even better. He induced 18.1% whiffs on his slider and 15.6% on his curveball. The major league average for a right-handed pitcher’s slider is around 13%, and 11% on a curveball.
While Hanson tossed just 127.2 innings at the major league level, he threw 194 cumulative innings in 2009. That increases the likelihood that he’ll be good for 30-plus starters this season. Bloomberg Sports’ projects him for exactly 30 starts and just over 180 innings. If that projection holds, Hanson could pass 15 wins in 2010, with some strong supporting numbers too.
 One knock on Hanson would be his home run rate. As a neutral pitcher with a 40% flyball rate, Hanson allowed just 0.72 home runs per nine innings. This was due to a lower than normal home run-to-fly ball rate of 6.9%; a starting pitcher is usually around 10% to 12%. Hanson should give up a few more long balls in 2010, but his ability to keep men off base could limit some to solo shots.
When looking for other young pitchers with similar starts to Hanson, Clayton Kershaw comes to mind. In 2008, Kershaw made 21 starts, going 5-5 with a 4.26 ERA. He then made 30 starts last season, posting a sparkling 2.79 ERA over 171 innings. Hanson’s stuff rivals Kershaw’s, as does his upside in terms of strikeouts and swing-and-miss ability.
Hanson is getting a lot of respect in drafts this year. He is the 25th-rated starting pitcher and places 95th overall in B-Rank. His average draft position (ADP) is 67.8. The ADP looks a bit high, but Hanson is worthy of a seventh-round draft pick is shallow leagues. Don’t hesitate to pull the trigger on him in your draft.
For more on Tommy Hanson and other potential young aces, check out Bloomberg Sports’ fantasy kits.
Fantasy Baseball Intelligence, Episodes 3 and 4
By Jonah Keri
The next two episodes of Bloomberg Sports’ fantasy baseball podcast are now live.
In Episode 3, Mark Berniker, Wayne Parillo and I tackle top pitchers and mid-round values.
In Episode 4, we tackle the outfield crop beyond the first round of the draft.
For more fantasy baseball player rankings and draft tips, check out Bloomberg Sports’ fantasy kit.
Casey Blake: Boring but Effective Fantasy Option
By R.J. Anderson
Casey Blake will enter this season as the Los Angeles Dodgers’ starting third baseman for the second consecutive season. Blake, 36, qualifies as a solid if unspectacular player. Last season he hit .280, popped 18 homers, drove in 79 runs a season, scored 84 runs and stole all of three bases. He’s an above-average hitter, no doubt, but is he worth a roster spot in a 12-team mixed league?

Such a question would be so much easier if the Dodgers used Blake like the Cleveland Indians did for years. Last season, Blake appeared in 134 games at third and two at first and left. The year before he appeared in enough games to become eligible at third base and first base, and in the past he’s been eligible at three positions at once. But if a Manny Ramirez suspension wasn’t enough to get Blake out in the pasture, then the addition of Jamey Carroll and Garret Anderson almost certainly won’t lure Blake to another position.

That means Blake’s numbers matter only relative to other third basemen in the league. Bloomberg ranks him as the 13th-best third baseman, and one going well below his B-Rank slot of 152. Instead, Blake is being drafted, on average, at 282nd. That’s a gap of more than 100 slots, indicating that Blake is being undervalued. He’s projected to nearly match last year’s numbers, with 19 homers, a .276 average, and 79 RBI.
That makes Blake a more attractive option than other hot corner bearers like Jorge Cantu, Mark DeRosa, Alex Gordon (destined to start the season on the disabled list), Scott Rolen, and Miguel Tejada.
Is Blake worth a roster spot? He’s not a sexy option, but yes, he’s worth drafting in 12-team mixed leagues. Target him in the late rounds, and take advantage of the huge gap between his likely value and his perceived value.
For more
information on other good third base options, check out Bloomberg Sports’ fantasy kit.
