Category: Dailies
The Scoop on Cliff Lee
By R.J. Anderson //
Most people presumed Cliff Lee would be a good fit for the Mariners when they acquired him this off-season. When an abdomen injury pushed his season back a few weeks, the condition alleviated some of the buzz surrounding him. Lee is five starts into his 2010 season and still people seem to look elsewhere when discussing the best starters to date. That’s a mistake. Not only is Lee pitching well; he’s pitching better than he ever has before.
Lee is averaging a little over seven innings per start, which totals 36.2 innings pitched. He’s struck out 32 batters and walked one. That would be a strikeout-to-walk ratio of 32, which is simply unheard of. The best strikeout-to-walk ratio in baseball history (for pitchers with at least 100 innings in a single season) is 11 – posted by Bret Saberhagen in 1994. Ben Sheets‘ 2006 season is the only other case of a double-digit strikeout-to-walk rate for a starting pitcher with at least 100 IP.
Aside from Saberhagen and Sheets, Curt Schilling is the only other pitcher to break the 9 K/BB barrier, which is fitting. During Schilling’s later years with the Diamondbacks, ESPN would always joke about whether Schilling’s win total would exceed his walk total. Now, Schilling never actually accomplished the feat, but Lee very well could. In fact, Lee actually has more wins (two) than walks at this moment – and given his performance to date, should have more wins, if not for lousy run support and other factors beyond his control.
Also, Lee has yet to allow a home run. That tidbit, combined with the walks and strikeouts, make his 3.44 ERA look absurdly high. Lee’s batting average on balls in play (BABIP) allowed is .341. That’s well above league average around .300 as well as his career norms, and should regress given that he’s supported by one of the best defenses in baseball, in a park that suits left-handed pitchers very well.
Lee’s FIP – which takes defense out of the equation – is a microscopic 1.44. His xFIP – which normalizes home run rates (i.e. attempts to strip out even more luck) – is a still excellent 2.93. Lee’s Cy Young winning xFIP was 3.57. Last year it was 3.69. He’s about a half run per nine innings better than when he was considered one of the best pitchers in baseball.

Now, don’t expect Lee to pitch quite this well all season; history tells us his walk and home run totals can’t stay this low forever. But he’s still a true elite pitcher, and can reasonably be mentioned in the same breath as Roy Halladay, Tim Lincecum, Ubaldo Jimenez and other star hurlers. Unless the plan is to ship him away for future help in deep keeper leagues, there’s no reason to trade or bench Lee. Instead, appreciate how great he really is.
Oh, and give kudos to the only batter Lee walked this year: Evan Longoria.
For more on Cliff Lee and other aces, check out Bloomberg Sports’ Fantasy Tools.
John Maine, Shoulder Fatigue, and His Release Point
By Bloomberg Sports //
Here are the facts: John Maine threw five pitches to Nyjer Morgan in his last start for the Mets and was pulled. Maine was then placed on the disabled list with chronic shoulder fatigue.
Which leads to the question: is it possible that Maine’s shoulder fatigue showed up in the pitching data? With the Bloomberg Sports’ Pro tool we decided to try and find out, focusing specifically on his release point.
The following graphic shows John Maine’s release points for the Morgan at-bat, along with the corresponding strike zone.

Quadrant A is of particular note – that’s the spot from which two of his pitches originated. The left side of the graphic shows the release points, while the right side is the strike zone. Highlighting a particular zone results in those specific pitches being highlighted in the strike zone.
Both pitches were balls, and neither reached 84 miles per hour. Or to put it another way, Maine released 40% of his pitches from Quadrant A, and 100% were balls. The three other pitches Maine threw were right on the edge of Quadrant A.
Five pitches is an insignificant sample size, so let’s look at all the pitches Maine has thrown this season and how many originated from Quadrant A.

Maine has thrown 768 total pitches, of which 31 came from Quadrant A. You can also see that Maine throws the majority of his pitches from the quadrant directly below A.
The following table provides a pitch results breakdown, including how many of the pitches were greater than or equal to 85 miles per hour.

What we see is that 4% of his pitches came from Quadrant A, more than 50% were balls, and just about half were greater than or equal to 85 miles per hour.
To get a clearer picture, here are John Maine’s pitches from 2008-2010 in an aggregate form.

The number in Quadrant A is a little difficult to read – it says 103.
The following table shows how many of Maine’s pitches over the years were thrown from Quadrant A, along with the results.

The data provide a clearer picture of what happened, including:
1) This season, Maine has already thrown nearly 1/3 of the total pitches he has ever
thrown from Quadrant A (103 for his career, with 31 this season)
2) Percentage wise, Maine has nearly doubled the number of pitches released from
Quadrant A (4% versus 2.21)
3) In this particular game, the velocity from the release point in Quadrant A was lower
than usual (41.74% for his career versus 0 for the game)
What exactly is wrong with Maine is best left up to the medical experts, and the data do not point directly to shoulder fatigue. What is evident is that this season, statistically speaking, he was releasing the ball from a higher point with more frequency, and was pitching differently.
(Audio) BTN with Dave Cameron of fangraphs.com
By Bloomberg Sports //
Listen now! – (loads in new browser)
Behind the Numbers
Hosts: Wayne Parillo and Rob Shaw
Guest: Dave Cameron of Fangraphs.com and USS Mariner
Total Running Time: 15:41
High Level Look
- What Mariner is Rob Shaw’s dog named after?
- Dave’s start at ussmariner.com
- Defense. Defense. Defense.
More ways to get Behind the Numbers, talk to us, or just have a good time
Why C.J. Wilson Might Not Be a Sell-High Fantasy Player
by Eno Sarris //
In the case of C.J. Wilson, it’s time to give Tommy Rancel a little credit for identifying him as a possible sleeper in the pre-season (while also illuminating some of the concerns with moving a pitcher from the bullpen to the rotation). Now that Wilson has started out well, the question immediately shifts to his value going forward, and whether or not he is a sell-high candidate. Despite struggling in his last two starts, his year-to-date numbers look strong, as the Bloomberg Sports Fantasy Tool charts to the right  show.
show.
At our disposal, we have tools like FIP (fielding independent pitching, which strips out batted ball luck and produces a number on the ERA scale). Wilson’s’ FIP is a decent 3.72. That’s probably the result of his lower strikeout rate (6.75 K/9) and .275 BABIP. While the strikeout rate is barely above average (6.6 K/9), the BABIP is actually less of a concern than usual.
Not all BABIPs are created equal. We talk about how it generally trends toward .300 across baseball, but that presupposes an average defense. Not all defenses are created equal. The Texas Rangers have the fifth-best defense in baseball when measured by UZR/150 – Ultimate Zone Rating. UZR attempts to take player positioning and ball trajectory, as well as home park intricacies, into account when rating defense. With Michael Young moved over to third base, defensive whiz Elvis Andrus doing great glove work – and even young Justin Smoak “Monster” bringing a nice glove with him to the major leagues – the ranking passes the sniff test. Finally, the Rangers as a team have allowed a .290 BABIP. So Wilson’s .275 BABIP may rise, but perhaps not as much as the average pitcher.
We are still left with a precipitous drop in Wilson’s strikeout rate. After setting a career high last year (10.26 K/9), some regression was inevitable due to his change in roles. Now that he’s dropped below his career rate (8.09 K/9), it’s hard to say what’s to come. We know that velocity and effectiveness usually drop with a move to the rotation, as pitchers can’t go all out every pitch for seven innings as a starter than they can for an inning or two as a reliever. Even accounting for those expected declines, though, Wilson’s velocity has fallen more than the average 0.7 MPH gap between starter and reliever (as Jeremy Greenhouse showed in an article last month). In fact, his fastball velocity has dropped 2.9 MPH with the move.
Still, we have a pitcher that has an average walk rate, a barely above-average strikeout rate, and one solid skill on his side. Wilson has continued inducing worm-burning grounders at a good rate (53.3% this year, 53% career), and that can limit the damage, as evidenced by his 0.48 HR/9 rate – it’s hard to get hit out of the park on the ground. While a home run rate that low is usually unsustainable, the nine pitchers that averaged less than 0.6 home runs per nine last year averaged a 49.3% groundball rate.
 Of course if you can get a return on Wilson from an owner that values him as an ace, do it. But always consider context. I’m currently in a Blog Wars league where I am about to accept a trade – my Roy Oswalt for his Miguel Montero and C.J. Wilson. I need the offense in this two-catcher deep league, and I don’t think the step down is too steep for my staff to handle. As you can see, the Bloomberg Sports Fantasy Tools trade analyzer likes the trade, an encouraging sign.
For more on C.J. Wilson and possible trade targets, check out Bloomberg Sports’ Fantasy Tools.
Analyzing Ben Sheets in Oakland
By Tommy Rancel //
Some were surprised when Ben Sheets signed a lucrative one-year deal with the Oakland Athletics. Sheets missed the entire 2009 season with an elbow injury. And the A’s generally don’t hand out $10 million dollar contracts. So far, the results have not been what either party was hoping for.
Sheets is just 2-3 after 10 starts. He is averaging less than six innings per outing and his ERA sits at 5.04. According to FIP (fielding independent pitching) and xFIP (expected fielding independent pitching), metrics that quantify factors a pitcher can control (including walks, strikeouts, and to some extent, home runs) there is nothing to suggest he has been outrageously unlucky. His 4.66 FIP and 4.69 xFIP are only slightly lower than his ERA.
In terms of strikeouts and home runs allowed, Sheets is near career norms. His strikeouts per nine innings rate (K/9) of 7.32 is near his career number of 7.59. His home runs per nine (HR/9) is up slightly to 1.14, but not too far from his career 1.01 HR/9.
The bulk of Sheets’ early-season struggles have come in the form of bases on balls. Throughout his big league career, Sheets has kept his walks to a minimum. His career walks per nine innings (BB/9) is a wonderful 2.07. In fact, from 2003 to 2006, his BB/9 was just 1.35 over 720.1 innings, a truly elite level.
In 2010, he has lost control. As it stands, his 2010 BB/9 is a career high 4.55. Here are some numbers to consider. In 2004, he walked 32 batters in 237 innings. In 2005, he walked 25 in 156.2 innings. He has walked 28 batters in 55 innings already this season.
Overall, Sheets has been disappointing, however, there are some signs of improvement. His May ERA of 5.08 is higher than his April ERA of 5.00, but his FIP and xFIP for the month of May have dropped to 4.25 and 4.05 respectively. Walks remain a problem (4.45 BB/9 in May), but his strikeouts have increased.
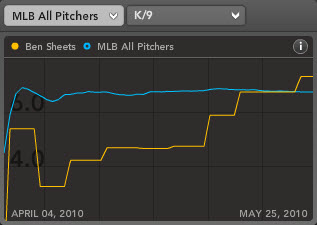
After striking out 14 batters in 27 innings in April (4.67 K/9), Sheets has struck out 31 batters in 28 May innings (9.85 K/9). Looking at pitch selection data, it seems Sheets improved K rates come with a change in pitches thrown.
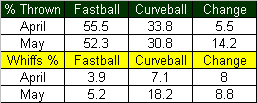
Sheets is throwing more change-ups now, and generating a lot more whiffs on his curveball. There was some talk of Sheets tipping his curve earlier this season, but it looks like he is back to fooling batters with it.
Even though his strikeouts are rising, the walks are still a concern. In addition to the free passes, his average fastball in 2010 of 91.3 miles per hour is about a mile and a half slower than his career average of 92.6 MPH.
If the A’s are not in playoff position come July 31st, Sheets will be a primary trade target for American League and National League teams alike. If you own Sheets in an AL-only league, consider floating his name in trades now – saving yourself the worries of the what-if’s later.
For more on Ben Sheets and possible trade candidates check out Bloomberg Sports’ Fantasy Tools.
(Video) Ballpark Figures: Stock Report
By Bloomberg Sports //
Ballpark Figures: Stock Report — Bloomberg Television’s Michele Steele and Bloomberg Sports Fantasy Analyst Rob Shaw are talking some baseball. Today, they discuss the bulls and bears on the fantasy baseball market. Shaw tells us that Rays super utility man Ben Zobrist is a great buy low option and Reds slugger Jonny Gomes is too streaky to depend on. Shaw also adds that Diamondbacks first baseman Adam LaRoche has a shot at 30 home runs this season, Orioles outfielder Luke Scott should be avoided, and Pirates pitcher Zach Duke will need a trade to gain fantasy value.
Jose Bautista vs. Adam Lind
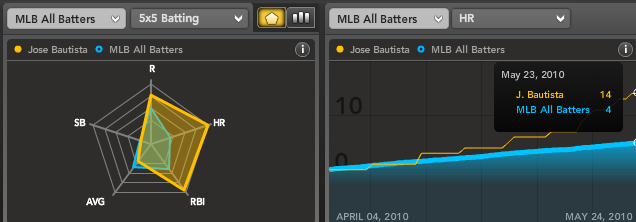
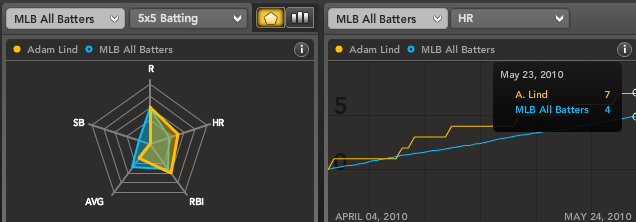
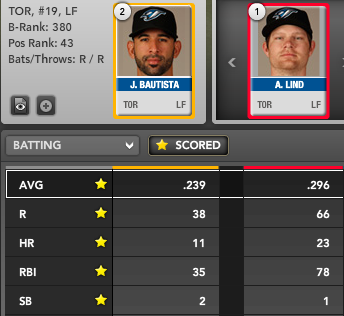
That said, some teams desperate for a shakeup might prefer the hot hand, and since we can’t make a strong case that luck, track record, or home environment weigh strongly on this decision, one wouldn’t be crazy at all to choose Bautista among the two.
Livan Hernandez Is a House of Cards
By R.J. Anderson //
Livan Hernandez has a strikeout-to-walk ratio of 1.06 and an ERA of 1.62. Having a good strikeout-to-walk ratio doesn’t guarantee a low ERA; evidently having a low ERA doesn’t always mean you need a killer K:BB rate either.
Still, recent history tells us that Hernandez is playing with fire. Twenty-five starting pitchers have posted full-season strikeout-to-walk ratios between 1.00 and 1.10 since 1990. Of those, exactly two finished with an ERA below 4.00. For the wave-riding owners of Hernandez’s shiny ERA, that’s bad news, unless the belief is that Hernandez can replicate Kirk McCaskill’s 1990 or Pat Rapp’s 1994. The cumulative ERA of those 25 pitchers is a less-than-stellar 4.79.
Perhaps the most amazing aspect of those pitchers is some of the win totals racked up. Hernandez currently has four wins, but there’s a chance he could join the 17 of 25 who won double-digit games. Kevin Ritz won 17 games in 1996. Omar Olivares, Scott Erickson, and Steve Trachsel won 15. Three others won 13; two more won 12; three won 11; and then the rest won 10 games.
Granted, by restricting our search to pitchers who lasted a full season, we’re sure to see higher win totals than you’d expect from pitchers with lower innings totals. Those innings totals, the ability of teams to overcome iffy starting pitching, and the questionable real-world value of Wins as a pitching stat, say more about these pitchers’ ability than any dubious claims of pitching to the score ever could.

Dave Cameron of FanGraphs recently pointed out that Hernandez’s performance with runners on base isn’t even that good, yet somehow runs just aren’t being piled on…yet.
If you own Hernandez and can get any type of return on him, do it, and do it now. It’s a very safe bet to make that he will not continue to have this level of success with the way he’s pitching. If you can’t find a fool on the market, then the choice to attempt and milk out one or two more solid weeks is up to you. But be warned, when regression catches up, it will take no prisoners.
For more on Livan Hernandez and other lucky dogs, check out Bloomberg Sports’ Fantasy Tools.
(Video) Ballpark Figures: Fantasy Headlines
By Bloomberg Sports //
Ballpark Figures: Fantasy Headlines — Bloomberg Television’s Michele Steele and Bloomberg Sports Fantasy Analyst Rob Shaw are talking some baseball. Today, they discuss some of the major news items in fantasy baseball. in particular, Shaw tells us to hold on the injury-prone Jimmy Rollins of the Philadelphia Phillies. He tells us to avoid Orioles closers including the recently injured Alfredo Simon. Finally, Shaw tells us to prepare for Tigers star Miguel Cabrera to miss a few games as his wife gives birth to his child.
Jon Garland Finds a Home at Petco Park
By Tommy Rancel //
After spending nine seasons in the American League, Jon Garland
is in year two of his National League West tour. The right-hander
signed with the Arizona Diamondbacks prior to the 2009 season, and was
traded mid-season to the Los Angeles Dodgers. Garland didn’t gather
much interest on the open market this off-season. He settled on a
one-year deal with another NL West team, the San Diego Padres, worth
slightly more than $5 million. In hindsight, it may have been the
smartest move of his career.
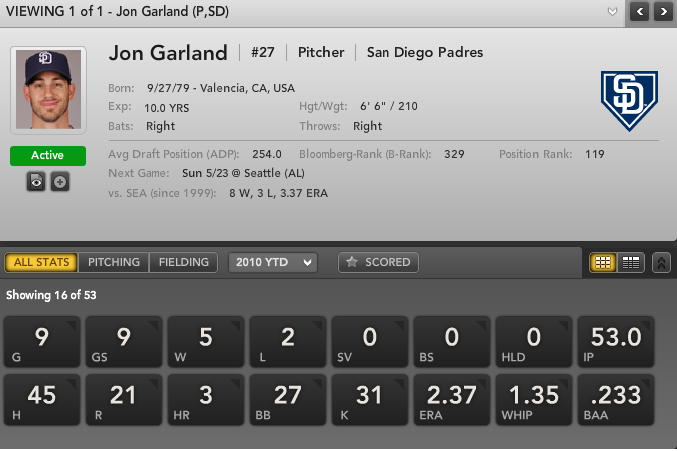
A
double-digit game winner in each season since 2002, Garland is already
halfway there in 2010. He goes into his next start with a 5-2 record in
nine starts. At first glance, his 2.38 ERA suggests a career season
thus far, but Garland has been the beneficiary of some good luck, and a
lot of home cooking.
Looking at FIP (fielding independent
pitching) and xFIP (expected fielding independent pitching), two
metrics that strip defense and luck from a pitcher’s performance,
Garland is pretty much the same pitcher he has always been. His 4.20
FIP is slightly lower than his career 4.70 FIP, but when we neutralize
his home run rate, his 2010 xFIP of 4.77 is actually slightly higher
than his career xFIP of 4.62.
Pitching in Petco Park has done
wonders for some of Garland’s numbers. The largest reason for his xFIP
being higher than normal is home run rate. In his career, Garland has
given up 1.10 home runs per nine innings (HR/9). Thanks to the spacious
dimensions of Petco – especially in right-center field – his HR/9 is
less than half that (0.51) thus far in 2010. In fact, he has not
allowed a home run in 25 innings at Petco; his HR/9 on the road is
0.96.
In addition to a suppressed home run rate, Garland has
enjoyed a lower than normal batting average on balls in play (BABIP) in
San Diego. Overall, his 2010 BABIP of .262 is nearly 30 points less
than his .289 career number. Looking at the home/road splits again, his
home BABIP of .224 is far below his relatively normal road BABIP of
.300.
Because of the lower home run and hit rates, his home
ERA (1.08) is two and a half runs lower than his road ERA (3.54). That
said, Garland has arguably been a better pitcher on the road, even if
the superficial stats don’t show it. Away from Petco, he is striking
out more than seven batters per nine innings (K/9); at home, his K/9 is
a microscopic 2.88. In addition to more Ks on the road, he is walking
fewer batters in enemy territory. He has allowed 11 walks in 28 road
innings, while handing out 16 free passes in 25 home innings (5.79
BB/9).
Regression to the mean tells us that at some point
Garland will come back to earth, and revert to career norms across the
board. However, regression doesn’t take into account that Petco Park
has been one of the most unfriendly home run parks over the past three
seasons (last or second-to-last in home runs per game every season
since 2007).
If the Padres keep up their winning ways, Garland
is likely to continue his quest for a ninth straight double-digit wins
season. However, Bloomberg Sports’ Fantasy Tools warns us of some rough patches ahead.

The
system projects Garland to go 8-10 with a 4.18 ERA for the rest of the
season. If you can live with season-ending totals of 10-13 wins, a
league-average ERA, and little in terms of strikeouts, then Garland is
a safe play. However, if you have better talents at the head of your
rotation, you might want to consider selling high on Garland. Even
Petco Park can’t prop him up forever.
For more on Jon Garland and the surprising San Diego Padres, check out Bloomberg Sports’ Fantasy Tools.
