Category: Dailies
Ian Desmond and Stephen Drew: A Tale of Fantasy Decision-Making
by Eno Sarris //
When you’re in the middle of a cross-country move, you can be forgiven for making some quick decisions about your lineup. Actually, if you ask a certain spouse, you will not be forgiven for ‘wasting time on your fantasy teams when you could be helping with the move.’ Pfft. This is important work here.
In one league, the Fantasy Lounge Roto Champs League, I’ve won two of the past three years — but my team is struggling a little right now. I drafted Alcides Escobar as my shortstop, and even though it took such a late pick that the rest of my team is reasonably strong (up to sixth from last), I’ve been struggling at shortstop and replaced Escobar with Ian Desmond recently. Someone dropped Stephen Drew the other day, though, so I immediately put in the claim for Drew, washed my hands of Desmond, and felt like my team had just gotten much better.
Should I have taken a longer look? These two players sport different approaches and different experience levels. But the results have been very similar. Take a look at the comparison on the right from Bloomberg Sports Fantasy Tools and you’ll see that these are both bottom-echelon fantasy options in standard 12-team mixed leagues. Bloomberg Sports’ new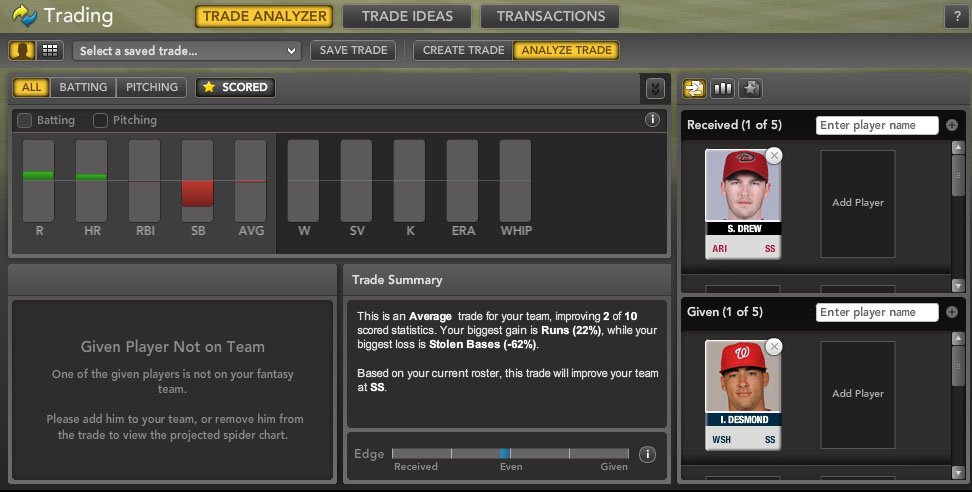 Trade Analyzer rates the move as an average one that improves my team in only two stats.
Desmond is hitting just .247 for the year, with four home runs and six steals to date. It’s not luck on the batted ball keeping him down, as his BABIP is about neutral (.295).
Stephen Drew has fared slightly better from a fantasy perspective. He leads Desmond by a comfortable margin in batting average (.268). The rest of the numbers look similar, though: steals (Desmond leads six to five), runs scored (Drew leads 36 to 27), RBI (Desmond leads 33 to 28) and homers (both have four). Like Desmond, Drew can’t blame his low batting average on BABIP, as he sits at .315. Sound familiar?
While their fantasy stats look alike, there are different players under the hood here. Drew walks twice as much as Desmond and has a track record as a superior power hitter. Drew has a .143 isolated power number (ISO, or slugging percentage minus batting average) while Desmond has put up a .124 ISO. Desmond has struck out at a higher rate (20.7% to 18.0%, ML average is 20.5%) and is reaching outside the zone at a much higher rate (34.9% to 24.7%, ML average is 28.4%). The two players’ 2010 triple-slash stats tell the story:
Drew: .268/.334/.412
Desmond: .248/.287/.372
Frustratingly, though, walk rate is not positively correlated with batting average. So though we know that Drew has more real-life value because of his walks, and we can appreciate his selective approach, we cannot say that a player that walks like he does will necessarily put up a high batting average. Look at Adam Dunn for an anecdotal piece of evidence in that regard. We also know that while Drew has more ISO this year and in the past (.172 career ISO), he’s on a three-year decline in that statistic.
So if you can’t depend on Drew for a strong batting average, his power has been on a decline, and he doesn’t own as much natural speed as Desmond, why is picking up Drew and dropping Desmond a no-brainer? Well, for one, strikeout rate is negatively correlated with batting average, so there’s a notch in Drew’s belt. Another reason has to do with track record. As we wrote in the preseason, Drew has shown the ability to hit for power and batting average in his short career, and at 27 years old, he shouldn’t yet be in his decline.
Finally, Drew’s aggregate offensive numbers, and defense, point to a much better real-life player at this stage of their respective careers. While Desmond and Drew sport similar UZR figures, UZR only becomes a reliable indicator of defensive ability once you have three years of data to peruse. What we do know right now is that Desmond is on pace for more than 40 errors this season, including a recent game in which his sloppy D cost Stephen Strasburg a win. The fact that Desmond is also a rookie means there’s a non-zero chance he’ll be sent back to the minors if he keeps struggling too.
If you’re looking for a fill-in shortstop in shallower leagues, or a player to hold in deeper ones, choose Drew over Desmond.
For more on Ian Desmond, Stephen Drew, Alcides Escobar, and other shortstop options, check out Bloomberg Sports’ Fantasy Tools.
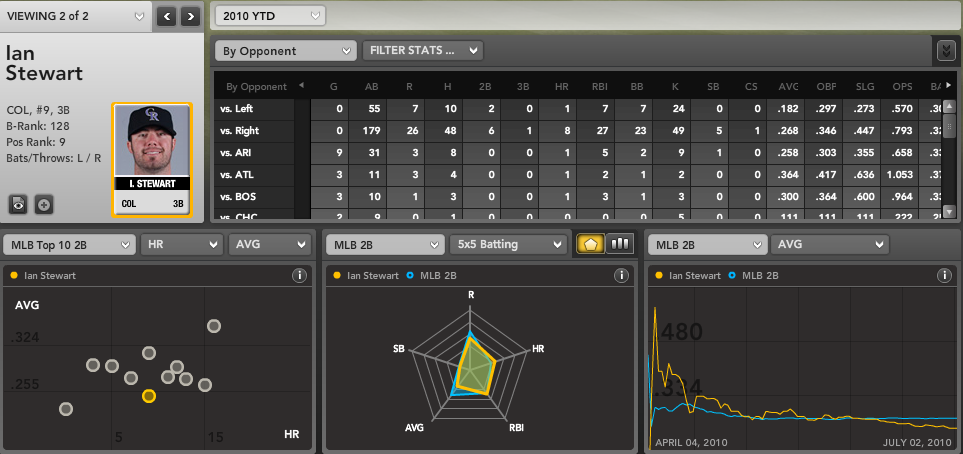
Time to give Gordon Beckham and Ian Stewart another chance?

Jonathan Papelbon: Buy, Sell or Hold?
By Tommy Rancel //
Despite being one of the majors’ hottest teams, the Boston Red Sox have some concerns. With Josh Beckett and Jacoby Ellsbury already on the shelf, Boston recently lost former American League MVP Dustin Pedroia and star catcher Victor Martinez to the disabled list. In addition to those players, Clay Buchholz is also nursing an injury.
There is plenty to worry about in Boston with that group of players. But any potential concerns about the performance of closer Jonathan Papelbon are premature.
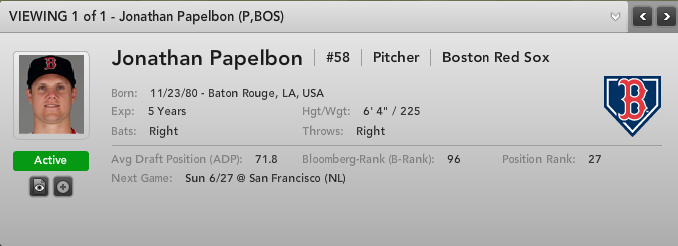
Anytime a player struggles in a major media market his troubles become magnified. In two straight appearances in Colorado last week, the 29-year-old right-hander allowed five runs on six hits, yielded two three home runs, and blew two straight saves.
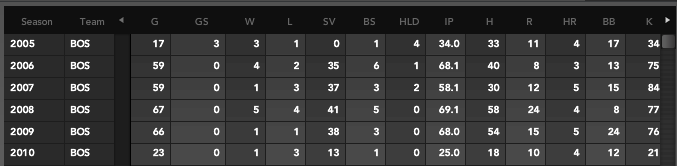
The Red Sox closer currently owns a 3.82 ERA in 31 appearances. Papelbon hasn’t posted an ERA over 2.65 in any of his previous five seasons. Outside of the expanded ERA, Papelbon is striking out fewer batters (7.64 strikeouts per nine innings) and walking more batters (3.31 walks per nine innings) than he ever has in a full season. To complete the trifecta, he is allowing home runs to leave the ballpark at a rate more than double his career level.
It might seem like it’s time to explore moving Papelbon off your fantasy team. But that’s probably a bad move, especially while he’s at his lowest perceived value. Besides, a number of advanced metrics suggest he will rebound quite favorably.
As mentioned Papelbon’s K/9 has fallen from a career mark of 10.17 per 9 IP to 7.64 in 2010. This is odd for a few reasons. His velocity of 94.6 mph on his fastball is nearly identical to his 94.5 mph career number. In addition to the velocity, Papelbon is still getting a lot of swinging strikeouts. His swinging strike percentage of 11.5% is actually higher than his 11.0% from a season ago.
Papelbon is also getting hitters to chase out of the zone (35.6% O-Swing) more than he has in previous seasons (30.4% O-Swing career). He’s throwing more first-pitch strikes (67.2%) which means he is not falling behind hitters. All signs point to Papelbon’s strikeout rate increasing, if his core skills remain steady.
Papelbon’s biggest problem has been the long ball. He has surrendered more home runs this season (6) than in any other season in his career, and we haven’t even reached the All-Star break. We mentioned that his HR/9 of 1.64 was more than twice his career number (0.73). A big reason for that is his elevated home run-to-flyball rate of 12.2%. For his career, 7.1% of the flyballs hit against him have left the yard. In four of his five previous seasons, he maintained a HR/FB% of 7.5% or less.
More likely than not, Papelbon’s problems are related to pitch location issues. We may also be seeing some outliers due to small sample sizes. With the potential for positive regression in terms of strikeouts, and a correction in the disproportionate rate of home runs allowed, Papelbon should maintain plenty of value. If you own him, remain patient. If you don’t, this may be a good time to trade for Papelbon at a discount.
For more on Jonathan Papelbon and other Boston Red Sox, check out Bloomberg Sports’ Fantasy Tools
(Video) Ballpark Figures: Stock Report
By Bloomberg Sports //
Ballpark Figures: Stock Report — Bloomberg Television’s Michele Steele and Bloomberg Sports Fantasy Analyst Rob Shaw talk some fantasy baseball. Today they discuss the Bulls and the Bears.
The Prince’s Pop
By R.J. Anderson //
Over the last three seasons Prince Fielder has hit 130 home runs; or a home run for every 16.1 plate appearances. This season, though, Fielder has hit 15 homers in 340 trips to the plate; a jack per 22.7 plate appearances. Not only that, but Fielder’s .206 ISO would represent the lowest figure of his career since becoming a full-time player. ISO generally stabilizes after 350 plate appearances; with the season nearly halfway over, is it time to start getting concerned about Fielder’s lacking power?
The first thing most analysts will look for when examining a power loss is the percentage of home runs per fly balls hit. Fielder’s HR/FB% is currently a tick more than 17%. This is lower than expected when compared to his career figure of 20.1%. Even when one breaks Fielder’s rates down on a seasonal basis, it shows that this is a low rate of homers per balls in the air:
2006: 15.8%
2007: 23.9%
2008: 18.2%
2009: 23.1%
Fielder is hitting the same number of flyballs as his career rate and also the same number of groundballs. His batting average on balls in play is relatively steady too, meaning he’s not being robbed on screaming liners in the gap, or at least it doesn’t seem like it. Fielder’s just not having as many balls clear the wall as usual.
Given his big build and specific skill set, some would point to this as the beginning of the end for Fielder’s elite status. That seems overly pessimistic. Fielder is only 26 years old and while his belt is roughly the size of an asteroid belt, that doesn’t mean he’d suddenly lose power.
The popular comparison here would be Mo Vaughn. A barrel-chested, lefty-swinging first baseman with a belly and power who reached the majors at a later point in his career than Fielder, Vaughn enjoyed similar success. He hit at least 25 home runs in every season he recorded 450 or more plate appearances. It was in 2003 that injuries swamped Vaughn’s usefulness and he eventually retired, inconveniently early into his free agent contract with the Mets. But at the age of 26, Vaughn actually posted the best season of his career (to that point) with a slash line of .310/.408/.576. The big man could still hit, and did so into his early 30s.
Cecil Fielder is another popular comparison because, well, come on. Other than bloodlines, the pair don’t share too much in common. Besides, the elder Fielder also recorded the best season of his career as a 26-year-old, blasting 51 bombs for the Detroit Tigers. That suggests an early decline isn’t hereditary, nor is it a given based on his size. As this chart provided from FanGraphs shows, Prince is just having an unusual drop that the other two didn’t experience:
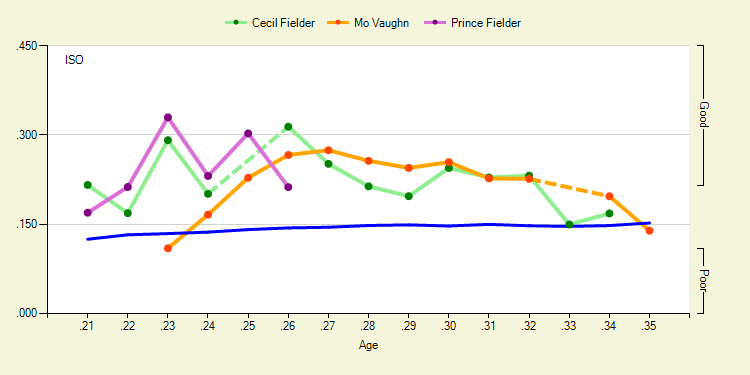
In the end, you should probably just keep Fielder on your roster, barring some unexpectedly massive trade offer. Expect some bounceback, because frankly there’s no reason not to.
(Video) Ballpark Figures: Fantasy Headlines
By Bloomberg Sports //
Ballpark Figures: Fantasy Headlines — Bloomberg Television’s Michele Steele and Bloomberg Fantasy Analyst Rob Shaw recap the weekend in the fantasy baseball scene. Among the topic discussed is the newest curse for the Boston Red Sox.
For the Bloomberg Sports, fantasy tool visit BloombergSports.com.
(Video) Ballpark Figures: Dose of Reality
By Bloomberg Sports //
Ballpark Figures: Dose of Reality — Find out what statistics Major League stars expect to produce in this week’s Ballpark Figures Dose of Reality. Bloomberg Television’s Michele Steele talks some fantasy baseball with Bloomberg Sports Fantasy Analyst Rob Shaw before interviewing Yankees star first baseman Mark Teixeira, Mets rookie phenom Ike Davis, Dodgers speedster Rafael Furcal, and Dodgers star closer Jonathan Broxton. Hear the insight, then go ahead and pick the players up for your fantasy team at Facebook.com/battersboxgame.
Introducing: Bloomberg Sports Front Office Baseball for iPhone
By Jonah Keri //
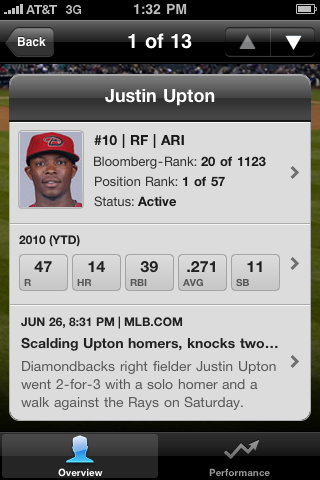
Bloomberg Sports recently broke into mobile Web with its new iPhone app, Bloomberg Sports Front Office Mobile. The app takes the best features of Bloomberg Sports’ Web-based Front Office and offers them in easy-to-use, portable form.
The app’s main screen lets you choose from 1239 players. You can sort them in multiple ways, including by B-Rank (Bloomberg Sports’ proprietary ranking of every major league player), or by MLB team.
In the Overview section, you can see a player’s B-Rank, position rank and injury status. The stats section’s default display includes the five basic scoring categories for typical 5×5 leagues: HR, RBI, R, AVG and SB for hitters, W, S, ERA, WHIP and K for pitchers. Click on the arrow and you get access to a wide range of other stats, including sabermetric gauges such as batting average on balls in play, pitches per plate appearance and dozens more batting, pitching and fielding metrics across multiple seasons. The news section gives you all the latest on-field happenings and injury reports from MLB.com. You can also eyeball each player’s upcoming matchups, then make changes in seconds to get your best 23 guys in your lineup.
Back to the home screen, you’ll find the My Teams tab, which gives you instant access to all the latest stats and happenings with the players who will decide your fantasy fate. Looking to upgrade your squad? The Watchlists tab lets you find the best replacements for your fantasy team in seconds, so you don’t have to wait to replace a season-long underachiever – sorry, Rich Harden – or a star now confined to the disabled list – ouch, Dustin Pedroia.
The app also lets you rank your own players, owned players, or players on the waiver wire by any combination of four categories, for those of you in 4×4 leagues or in 5×5 leagues where you’re looking to punt, say, saves and try to load up elsewhere.
The Performance tab lets you drill deeper. You can view performance over time using Bloomberg Sports’ trend charts, tapping and holding for stats (one finger) and changes (two fingers). Use the radar chart to compare a player’s multi-stat profile with league benchmarks. For every player, you’ll find the same visually-rich charts and displays seen in Bloomberg Sports Front Office’s Web version – including the spider chart, which lets you visualize how a player stacks up to the rest of the league in five categories, with a simple glance.You’ll also find trend lines, which tell you how your player has performed compared to league average, as well on a daily basis throughout the season.

Available in the iTunes app store (www.itunes.com/appstore), the Bloomberg Sports Front Office Baseball 2010 app is free to download, providing access to these and other features for the top 10 hitters and pitchers in each league. Information for all MLB players, as well as watchlists and personalized team settings, can be purchase as an upgrade for $4.99. Existing subscribers to Bloomberg Sports fantasy baseball Web tools can access the full app for no extra charge by using your current login information.
Give it a spin.
(Audio) BTN with guest Rob Neyer (part 1 of 2)
By Bloomberg Sports //
Listen to the conversation now! – (loads in a new browser)
This is part 1 of a 2 part interview
Hosts: Wayne Parillo and Rob Shaw
Guest: Rob Neyer of ESPN and Rob Neyer Baseball
Total Running Time: 16:03
Topics
- Growing up a Royals fan in the 70s
- The Holy Grail of stats
- When the competitive balance changed
Direct link to the conversation
More ways to get Behind the Numbers or talk to us
Should You Sell High on Ubaldo Jimenez?
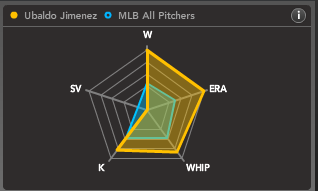
- He’s averaging about 7.99 strikeouts per 9 innings. That ranks him 26th among starters with at least 70 IP this season. He’s behind Colby Lewis, Ricky Romero, and Gavin Floyd, to name three pitchers with much less star power.
- He’s averaging 3.03 walks per 9 innings. That ranks him 54th among starters with at least 70 IP. Among the pitchers walking batters at a lower rate are Brian Bannister, Kyle Kendrick, and once again, Gavin Floyd.
- He’s averaging 0.34 home runs per 9 innings.That ranks him 6th among qualified starters. However, only 4.4% of his fly balls are going for home runs. His career rate is 7.6%, and he plays half his games at Coors Field. That’s very likely to regress.
- His strand rate is 87.8%, meaning 87.8% of the runners he puts on base don’t score. That’s largely a function of fortuitous timing (pitching abnormally and probably unsustainably well with men on base), as well as unusually strong bullpen bullpen. That’s also the luckiest rate in the entire major leagues.

