James Shields: Sink or Swim in 2011?
By Tommy Rancel //
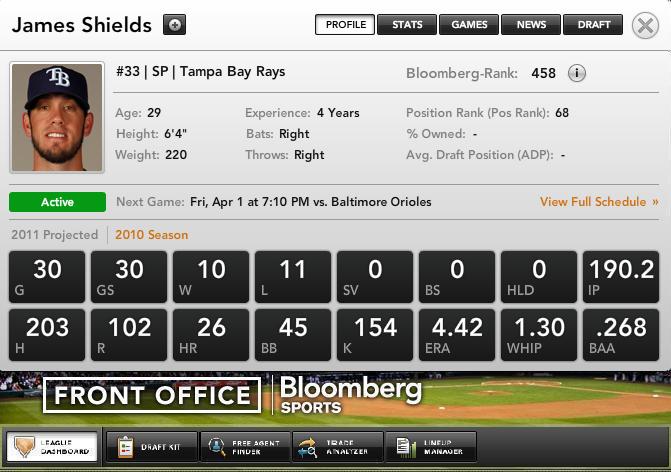
On the surface, James Shields had a poor season in 2010. The Rays’ opening day starter got off to a hot start with a 5-2 record, 2.99 ERA, and 71 strikeouts in his first 10 starts. Unfortunately, he would go 8-13 the rest of the way with an ERA of 6.31 in his final 24 appearances. Many in the Tampa Bay area soured on Shields; however, the organization, manager Joe Maddon, and progressive analysts think Shields’ traditional stats will rebound in 2011.
Shields earned a dubious triple crown in 2010 by leading the league in hits, earned runs, and home runs allowed. He watched 34 bombs leave the yard on the strength of a home run-to-flyball rate of 13.8%. This number is two percent higher than his career average and the highest among major league starters with at least 200 innings pitched. Shields has always given up his fair share of longballs, but is unlikely to get shelled like this going forward.
In addition to the home run issues, Shields was labeled as hittable with 246 hits allowed. His batting average on balls in play (BABIP) of .341 was nearly 40 points above the league average, more than 20 points higher than the next closest starter with at least 200 innings, and around 70 points higher than any of the other Rays’ starters. In fact, the next highest BABIP in the Rays’ rotation came from Wade Davis and Matt Garza at .272 apiece. This means Shields was extremely unlucky or was somewhat unlucky with other factors involved since he pitched with the same defense and in the same environment.
While luck was definitely involved, Shields also didn’t do himself any favors with pitch selection and location. He went to his fastball and cut-fastball far too often and in some cases left them in the nitro zone. Since it is the same fastball he has had success with in the past, a change in selection could go a long way; especially considering his change-up remains one of the premier pitches in the league.
The struggles with home runs and hits allowed have been documented. Meanwhile, Shields did quite well last season in other areas. He posted a career high in strikeouts (187 in 203.1 innings) and gave up just 2.3 walks per nine innings. According to his 3.72 xFIP (expected fielding independent pitching) – a metric that measures walks, strikeouts, and uses the leave average home run rate to further strip luck out of the equation- Shields actually had a very good season.
Shields is similar to Ricky Nolasco in a few ways. Both starters posted good strikeout rates, solid walk totals, but were bitten by the long ball. Not surprisingly, both had better showings in defensive independent metrics than their ERA. This may scare away prospective owners on draft day, leaving them as quality choices on the scrap heap.
In the case of Shields, regression to the mean will help, but he’ll also have to do a better job of mixing up his pitches and spotting the ball around the zone. He did this from 2007-2009 when he averaged 12 wins, a 3.85 ERA, and over 200 innings per season. His durability alone (four straight seasons of at least 31 starts and 200 innings) makes him a back-end of the rotation target, but the chance for regression could make him a real steal in the later rounds of a mixed-league draft.
