Phil Hughes: Lucky, But How Lucky?

by Eno Sarris //

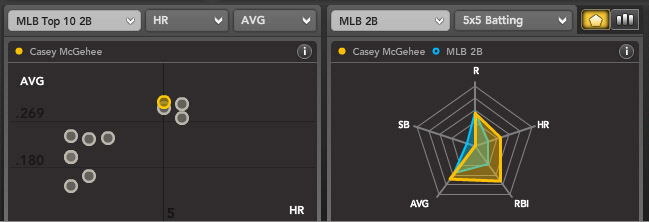
Any time a pitcher has an early-season ERA more than two-and-a-half runs lower than their career ERA, the easy tendency is to attribute the success to luck. And to some extent, this is true – it’s very, very rare for a 4.00 ERA pitcher to put up a full season with a 2.50 ERA. But young pitchers also make strides, and real progress shouldn’t be discounted. Where does Phil Hughes fall in this spectrum? If you look at the spider graph below from Bloomberg Sports Fantasy Tools, he’s certainly looking good right now.
HughesGrab.jpg
First, let’s tackle the low-hanging fruit. Batters have a .162 batting average on balls in play against Hughes right now. That number will regress toward the .286 career BABIP that Hughes has accumulated. That means more dinks and dunks and line drives past outstretched gloves – and more runs. Hughes has also stranded 87.4% of his batters on base; MLB average for that largely luck-based stat is usually around 70% MLB-wide. So we know that some correction is on the way with Hughes.

HughesVelo.jpg
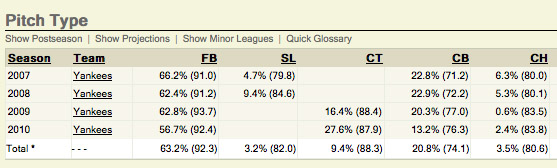
But Hughes has also made some legitimate strides. Check out Hughes’ fastball velocity on FanGraphs; much was made of an initial drop in his velocity, from the mid-90s to a less exciting 91 MPH. Then the team moved him to the bullpen, where pitchers traditionally add about 0.7 miles per hour in velocity according to this study by Jeremy Greenhouse. In the bullpen, Hughes’ fastball started crossing the plate at an average velocity of 93.7 MPH, making him an outlier in terms of adding gas. The good news is that Hughes is currently starting and he retained some of that extra oomph, as he’s averaging 92.4 MPH this year.

Typically, when trying to get at the true talent of a pitcher that is suffering from either bad or good luck, it helps to look at a players’ FIP (fielding-independent pitching). This number strips out BABIP, strand rate, park effects, defensive impact and other factors to get at what a pitcher “should” be putting up in an ERA scale. Hughes’ FIP right now is 3.14, based mainly on his excellent strikeout rate (8.64 K/9). But if you look at Hughes’ xFIP (expected fielding-independent pitching), you’ll see that he’s sporting a more moderate 4.26 number. What gives?

Hughes’ xFIP takes into account that the home run per flyball rate across baseball comes in between 9-11% and that few pitchers stray far outside of this range. But right now, Hughes has a 3.3% HR/FB rate. Even regressing that towards his low career 7.5% number would mean more home runs are on the way.

Wait, you might say – Hughes has a 0.27 HR/9 in 300+ minor league innings, and a 0.83 HR/9 in the majors. Why can’t he limit the number of home runs he gives up? Well, once the ball is in the air he has less control. About one of every 10 fly balls leaves the park across baseball, and that number holds steady, which has spawned more than one impassioned plea for the use of xFIP over FIP. The best way to limit home runs is to keep the ball on the ground, that much we can understand. Hughes is a flyball pitcher with a low groundball rate (36.2% this year). He doesn’t fit the homer-suppression profile.

Rest-of-season projections that use this knowledge of home run rates predict that Hughes will put up about a 4.3 ERA from here on out. This sounds like a big letdown, but it would still result in an ERA around 3.70 for the year. If you told a Hughes owner that he would get a 3.70 ERA with a WHIP under 1.3 and almost one strikeout per inning from his pitcher by the end of the year, he’d be thrilled. Unless you get a knockout sell-high offer on Hughes, hang onto him.

For more on Phil Hughes, check out Bloomberg Sports Fantasy Tools.

Buy-Low Candidate: Justin Masterson

By Tommy Rancel //

Under most circumstances, a pitcher who is 0-3 with a 5.40 ERA would be close to a benching – if not dropped – in most fantasy leagues. However, Justin Masterson is a player you should be actively seeking on the waiver wire or via trade.

Masterson has been a portrait of inconsistency in his five starts this season. He pitched 7.2 innings in his last start, following two starts in which he went eight innings total. Despite the winless record and the high ERA, there is a lot to like about Masterson.

First, we have a terrific strikeout rate. With 31 strikeouts in 26.2 innings, the young righty boasts a strikeout per nine (K/9) rate of 10.46. Only Tim Lincecum and Justin Verlander were in that territory last season. Of course the small sample size rules apply, but if he regresses toward his career K/9 of 8.03, that would still translate into 150 strikeouts should he pitch 170 innings.

mastrent.png

In addition to the favorable strikeout rates, Masterson is a noted groundball machine. He has induced 54.2% groundballs in his career, and is currently getting grounders 57% of the time so far in 2010. His career numbers suggest that is perfectly sustainable. Again, we love groundballs because they limit the damage that can be done on a ball hit in play. In fact, more than two-thirds (66.9%) of at-bats against Masterson end in a strikeout, a groundout, or a single.

With all that said, Masterson does have flaws. His career walks per nine (BB/9) rate is a bit high at 4.13. This season his BB/9 is 4.05. On the other hand, when a pitcher is getting more than a strikeout per inning, as well as almost 60% groundballs, you can accept a few walks.

The biggest cause of Masterson’s inflated ERA thus far has been bad luck. His batting average on balls in play (BABIP) thus far is an astronomical .420. A normal BABIP for a pitcher is near .300 and Masterson’s career number is .304. Expect regression to come soon, and with it a big improvement in his fantasy numbers.

Here’s another example of Masterson’s terrible luck: Less than one-fifth of the balls (18.5%) hit off Masterson are flyballs. Yet, almost one-third of those flyballs are leaving the yard. Masterson’s current home run-to-flyball rate (HR/FB) of 26.7% is the highest in the league. That number is more than double his career number of 13.2% and much higher than last year’s “leader”, Braden Looper, who had a 15.8% HR/FB for the Brewers.

When his BABIP and home run rates regress, Masterson should see a significant drop in ERA. Presently, his fielding independent pitching (FIP), which measures strikeouts, walks and home runs, is 4.30 – a full run less than his ERA. Going even further, his expected FIP  or xFIP, which normalizes his home run rates to further remove “luck” from the equation, and give a more accurate look at true talent level, is an excellent 3.12 – the fourth-best mark in the majors.

mascard.png

Masterson, 25, is still learning how to pitch at the major league level. In general, a starting pitcher needs at least three pitches in order to survive lineups turning over three or four times a night. Right now, Masterson is living dangerously with just his fastball and slider. There are two versions of the fastball: four-seam and sinker; however, batters are seeing some form of the hard stuff nearly 85% of the time. He has been throwing his slider nearly 14% and barely using his change-up, which has a usage of less than 2%.

The sinker/slider combo, as well as Masterson’s three-quarters delivery, have been effective against righties, who are hitting just .226/.288/.302 vs. Masterson. Meanwhile, the heavy heater diet has been a feast for lefties who are smashing him to the tune of .414/.493/.655. If Masterson could spend some time with new teammate Mitch Talbot, the owner of a plus change-up, he could use that pitch as a great equalizer against his left-handers. 

All things considered – the strikeouts, the expected regression, and the groundballs – Masterson has the tools to be a solid starter in the American League. Currently, he is available in nearly 60% of leagues.

If you are in a mixed-league, pick him up. If you are in a deeper league or an AL-only league, in which he is owned, it shouldn’t take much to pry him away from an owner who is concerned with ERA. There will be some growing pains, but the potential for reward outweighs the relatively low risk.

For more on Justin Masterson and other buy low candidates, check Bloomberg Sports’ Fantasy Kits.

(Video) BallPark Figures: Stock Report

by Jonah Keri //

BallPark Figures: Stock Report — Bloomberg TV’s Michele Steele talks fantasy baseball with Bloomberg Sports’ fantasy analyst Rob Shaw. In today’s Ballpark Figures: Stock Report, Shaw tells us that Cardinals young third baseman David Freese is a bull on the rise, Indians outfielder Austin Kearns is bound to struggle, and Eric Young Jr., is an intriguing middle infield option that will enjoy greater fantasy value once the Rockies return to the hitter-friendly Coors Field.

What Does Tomorrow Bring for Brandon Morrow?

By R.J. Anderson //

Almost every aspect of Brandon Morrow’s career has resembled a roller coaster ride. So is there any surprise that Morrow’s 2010 season is replicating that model?

Drafted by the Seattle Mariners as the fifth overall pick in the 2006 draft ahead of hometown hero Tim Lincecum, Morrow failed to live up to expectations in the great northwest. Struggles with command and health restrictions that kept him in the bullpen for most of his Mariner career marked his downfall. Over the off-season he was dealt to the Blue Jays for reliever Brandon League.

The Jays placed Morrow in the rotation, hoping to squeeze the most value possible out of the right-hander. He’s since made five starts, yielding a 5.46 ERA. Morrow has allowed 17 earned runs, but seven came in one start and 12 came in the first two starts. In his last three starts he’s posted the following line: 19 IP, 25 SO, 10 BB, and a 2.37 ERA.

morrow1.png
As always. Morrow features an explosive fastball at
upwards of 96 miles per hour. That velocity, combined with his draft
status, helped Morrow secure an annual position on numerous breakthrough
lists in the past two seasons. The hype makes hot stretches like the
one Morrow is now in difficult to evaluate without bias.

There is reason
to believe this is just a hot stretch, though, and not the new
standard.
Morrow has shown short stretches of success in the past, without following through. In September 2008, Morrow made a pair of starts against the New York Yankees and Los Angeles Angels of Anaheim. He pitched quite well, striking out a batter per inning and posting a 2.13 ERA. In July 2009 Morrow made four starts in which he struck out 21 and walked nine. 

The only change in Morrow’s per nine ratios this season is his strikeout rate and a slight deflation in his home run rate – although he’s allowing the same number of home runs per fly balls hit. That increase in strikeout rate just screams unsustainable. Morrow’s swinging strike rate is up one whiff per 100 pitches – from 10% to 11% — and the only change in pitch approach is the strong implementation of a curveball. It’s interesting to see that Morrow is throwing his curve the most on 0-1, 0-2, and 1-2 counts per data from FanGraphs, suggesting the key to his success has been an increase in strikes looking, rather than of the swinging variety.

morrow2.pngReality and history suggest Morrow simply will not continue to strike out more than a batter per inning. Consider that Morrow has only faced two American League East opponents this season (Baltimore and Tampa Bay) and those starts combined to see him walk 11. Also note that he’s yet to face the Red Sox or Yankees.

There’s a chance Morrow can post a sub-4 ERA, but don’t bet on it. If you can sell high, do it.

For more on Brandon Morrow, check out Bloomberg Sports Fantasy Tools. 

var OutbrainPermaLink=’http://bloombergsports.mlblogs.com/wp-content/uploads/2010/05/morrow2-thumb-550×216-19963914.pngarchives/2010/04/chris-volstad-and-pitching-truths.html’;
var OB_Template = “mlbblogs”;
var OB_demoMode = false;
var OBITm = “1241712535489”;
var OB_langJS =’http://widgets.outbrain.com/lang_en.js’;
if ( typeof(OB_Script)!=’undefined’ )
OutbrainStart();
else {
var OB_Script = true;
var str = ”;
document.write(str);
}

Casey McGehee’s Fast Start

by Eno Sarris //

Sometimes a player outperforms his minor league numbers by such a wide margin that it’s tempting to call it a Cinderella story on par with the imaginations of Bill Murray in Caddyshack. At the same time, the urge to dismiss such performance as luck is very strong as well.

To be fair to Casey McGehee, he did have an impressive debut. In fact, his .859 OPS in 2009 was the third-best OPS put up by a 26-27 year old debuting at second or third base since 1901 – if you set a 350-at-bat and 15-home run threshold. That threshold is significant, though: The power is the most surprising part of his game, as we will see.

First, let’s appreciate how nicely McGehee is following up his debut season. Since McGehee is eligible at second base in most leagues, we can take a look at how he stacks up against other second sackers in the spider chart on the right from Bloomberg Sports Fantasy Tools. Sure, he’s not giving his owners many stolen bases, but otherwise he’s been more than solid. See those three dots clustered around McGehee in the scatter plot? They represent Dan Uggla, Chase Utley and Dustin Pedroia. Heady company for the young Brewer.

But this sort of debut didn’t seem to be in the cards, based on his pre-major league career. His combined minor league line was .279/.332/.409; now, 518 plate appearances into his major league career, his line with the Brewers is .295/.355/.496. Maybe there’s something in the water (or beer) in Milwaukee. Of course the question is whether or not he can continue his elevated play, because those 2,800 minor league plate appearances weigh heavily against that proposition.

First, let’s look at his patience. McGehee has been showing an average walk rate in the majors (8.9%) and he’s bumped that up this year (12.1%) by not swinging… at anything. Swing rate is significant early in the season, and his 37% swing rate makes him the 20th-toughest player in baseball to coax into a swing this year. While he didn’t have great OBPs in the minor leagues, McGehee had above-average walk rates many years. Combined with his current swing rate, it looks like he’s become a more patient hitter and that his nice OBPs may continue.

The million dollar question, however, is if he will continue to show the same power. His isolated power (SLG% – BA) is .257 this year, .200 for his major league career, and .130 for his minor league career. That’s a stark difference right there. A quick check of the sample sizes needed for certain statistics to become significant shows us that ISO is one of the last offensive statistics to do so. In fact, McGehee has not yet reached the level of plate appearances at which his ISO would become significant, counting his career major league plate appearances (let alone one month worth of data this season). In other words, other players that racked up fewer than 550 plate appearances had an ISO that was less than 70% correlated with their future ISOs.

The strongest sign that McGehee’s performance will start correcting is his HR/FB rate. Right now he’s hitting fewer than a third of his balls in the air, yet 18.5% of them are leaving the park. That percentage is on par with Justin Upton, Adrian Gonzalez, and Evan Longoria, some of the most powerful sluggers in the game.

Unfortunately for McGehee and his owners, that’s the part of his game most likely to regress toward the mean. McGehee would still remain a playable option in mixed leagues if his power numbers fall back to Earth. But if someone in your league sees him as an elite infield option, you should consider looking into a trade.

For more on Casey McGehee, Martin Prado and other players outperforming their minor league statistics, check out Bloomberg Sports Fantasy Tools. McGeheeGrab.jpg 

What’s Wrong With Javier Vazquez?


By Tommy Rancel //

The answer to that question is…a lot; at least right now.

After finishing fourth in the National League Cy Young award vote as a member of the Atlanta Braves in 2009, Javier Vazquez is now the fifth-best starter for the New York Yankees in 2010.

Whether he’s earned it or not, Vazquez has gained a reputation for wilting in the spotlight. He struggled in his first stint as a Yankee in 2004, and was called out by White Sox manager Ozzie Guillen for not being a big game pitcher as a member of the Chicago rotation. With a 1-3 record and a 9.78 ERA after five turns through the rotation this year, he has only added fuel to the fire.

The biggest problem for Vazquez has been his control. In each of the past 10 seasons, Vazquez has maintained a walks per nine (BB/9) under 3.0. In fact, in five of those seasons – including 2009 – he held his BB/9 under 2.0. Here’s your first sample size warning, but so far Vazquez has walked 5.78 batters per nine innings. In addition to the increase in walks, Vazquez has seen his strikeouts per nine (K/9) fall from 9.77 in ’09 to 7.83 thus far. A K/9 of near 8.0 is still good, and very close to his career number of 8.14.

More walks and slightly fewer strikeouts are part of the problem, but so is some flukish batted ball data. Currently, Vazquez has allowed a batting average on balls in play (BABIP) of .349. His career number is .309. Vazquez has always been prone to the long ball with a career home run per nine innings (HR/9) of 1.17 and a home run-to-fly ball rate (HR/FB) of 11.3%. But this year those numbers are off the charts: HR/9 of 3.13, with a HR/FB of 22.2%. It’s safe to say with more time and a larger sample size, these numbers will regress toward career levels.

Beyond the controllable stats like walks and strikeouts, and the easily skewed batted ball data of the early season, one thing to look for when a good pitcher struggles – or when a pitcher is having surprising success – is pitch selection.  For examples, check recent Bloomberg Sports’ articles on Kevin Gregg and Mike Pelfrey.

Here are some questions when looking at pitch data: Has something dramatically changed? Is the pitcher relying on one pitch too much? Is he working on a new pitch? All of these could be viable explanations. Just not in Vazquez’s case.


vaz.png

Looking at the pitch selection year-over-year for Vazquez, not much has changed. Keep in mind we’re comparing 200+ innings with 20 innings, but each pitch has been used within a one percent of last season’s total.

While the selection is the same, the effectiveness has changed. Vazquez got 12.3% swinging strikes last season. For reference, Tim Lincecum induced 13.4% whiffs last year, so Vazquez did pretty well. In his five starts so far, he has a swinging strike percentage of just 8.6%. That’s down sharply from his career 11.6% mark. The biggest difference has been on Vazquez’s change-up – from 21.9% whiffs in ’09 to 12.3% in ’10. Behind the change-up is his curveball: 17.9% swings and misses in 2009 to 11.8% so far this season.

One potential problem with the change-up could be velocity separation from the fastball. Thrown with a similar grip to the fastball, the change-up’s biggest asset is fooling the batter into thinking it’s a heater. It keeps the batter off balance due to decreased velocity and sharp movement.

Throughout his career, Vazquez has maintained about 10.5 miles per hour on separation on the two pitches. This year, the separation difference is less than 8.5 MPH. His change-up velocity is within two-tenths of career level, but his fastball is down from 91.2 MPH (career) to 88.9 MPH (2010). A decrease of more than two miles per hour is probably the biggest cause for concern with Vazquez.

We are not doctors; therefore we won’t speculate about injuries. However, Frankie Piliere, a former major league scout and now writer for AOL Fanhouse, suggests that it is a mechanical flaw that has his velocity and control down.

There is a chance Vazquez continues to struggle all season, but with the limited data on the season, it’s just too early to make that assumption given his history as one of the game’s better starters. With simple regression alone on batted balls, Vazquez is likely to improve as the season progresses. If you own Vazquez try to remain patient. As Piliere, notes a mechanical flaw is not the easiest thing to correct during the season, so there may more ugly in his future than good.

Still, some caution is advised. Vazquez has always been a flyball pitcher. A right-handed flyball pitcher pitcher in front of Yankee Stadium’s short porch was never going to be a perfect match. Going from the National League to the brutal AL East was going to naturally inflate his numbers too, given the typical gap of up to half a run scored per game seen between the two leagues in recent years. If Vazquez’s other problems persist, his attempt at an in-season rebound becomes that much tougher. 

For more on Javier Vazquez and the New York Yankees, check out Bloomberg Sports’ fantasy kits

Chris Volstad and Pitching Truths

by Eno Sarris //

We hold these truths to be self-evident, that there are different results on different types of batted balls, and that across baseball, these results hold steady from year to year.

When a pitcher has allowed a line drive this year, the batter has put up a .732/.730/.997 batting line.
When a pitcher has allowed a flyball this year, the batter has put up a .226/.220/.595 batting line.
When a pitcher has allowed a groundball this year, the batter has put up a .219/.219/.238 batting line.

Unfortunately for pitchers, there is little evidence that they can control line drives from year to year. Fortunately for pitchers, there is evidence that they can control the other two. Take a look at the slugging percentages on groundballs versus flyballs in particular. 

This brings us to Chris Volstad, a pitcher that is owned in virtually no leagues – at the time of this writing, he was available in 97% of Yahoo leagues. There’s a reason for that. Check out this screen grab from the Bloomberg Sports Fantasy Tools. Volstad is doing very little right this year.
VolstadGrab.jpg

Very little is not nothing, on the other hand. Volstad has one important thing going for him. He can induce groundballs. His career groundball percentage is 50.6% and even in his struggles this year, he’s got a nice 48.2% number. That puts him at 40th in the league, which is not bad in itself. It is early going, though. If he had put up his career groundball percentage last year, Volstad would have been 13th in the league, right behind Adam Wainwright and in good company with Josh Johnson right behind him.

Returning to Steve Slowinski’s piece on the levels at which statistics become significant, we find this about pitchers:

Pitching Statistics:

  • 150 BF – K/PA, grounder rate, line drive rate
  • 200 BF – flyball rate, GB/FB
  • 500 BF – K/BB, pop up rate
  • 550 BF – BB/PA

We will have to count this as good news in Volstad’s case. He has a career strikeout rate of 5.67 K/9 and this year he’s lagging behind with a 3.47 K/9. Since he’s only faced 102 batters, we can hope the strikeout rate will rise. Derek Lowe was long successful with a 60% groundball rate, 5+ K/9 and a sub-3 BB/9, and these are all levels that Volstad could reach with a little work.   

It can be tough to try and dominate your fantasy league with a groundballer, that much is true. Especially the groundballers that don’t strike people out, since strikeouts are a category in almost any league. There are also better groundball pitchers than Volstad out there, and RJ pointed out a couple of them just last week. Volstad’s contact rate (88.1% this year, 83.4% career) actually sits in between the two pitchers RJ talked about (Mike Leake and Doug Fister), so he’s an interesting test case. He’s the third amigo you could say.

Perhaps you can leave Volstad on the wire for now. But don’t let anyone convince you that he doesn’t do anything well. Watch his groundball rates, and if they rise, and he manages to strike a few out along the way, he could easily make a good pickup in a deep league.

For more on the three amigos, Mike Leake, Doug Fister and Chris Volstad, check out Bloomberg Sports Fantasy Tools. 

Should you hold onto Nate McLouth, Jason Kubel and Alexei Ramirez?

By Eriq Gardner
 
One of the tougher tasks in fantasy baseball is deciding the appropriate time to let go of an underperforming player.
 
Cutting bait on high draft investments isn’t easy. Some players have experienced great past success. Some hold the potential for tremendous upside. If you drop one of these players, you’re admitting you were wrong in the draft. You may be giving your competitor an opportunity to capitalize on the mistake of a player dropped too early. Imagining a player finally performing up to expectation on another competitor’s team may be too much to handle. 
I call these players “toxic assets,” too much potential value to drop and too little return to do much good. At some point, though, fantasy teams can’t afford to burn valuable roster spots waiting for a player’s fortunes to turn around.
 
Let’s look at some toxic assets at the moment.
natemclouth.png
Nate McLouth went in the 10th round on average in 12-team mixed leagues. Despite hitting .160 with just a single home run, four runs scored, and three RBIs he’s still owned in more than two-thirds of all leagues. That’s understandable considering he was a stolen base shy last year of his second consecutive 20/20 season. This time last year, many saw him as a potential 30/30 candidate.
 
But McLouth is really struggling in Atlanta. His strikeout rate has jumped from a career mark of about 19% before this season to 34% in 2010. He’s taking a few more walks than before, but he hardly seems to be doing anything once he’s on base: no steals so far, not even an attempt. 
 
His lineup opportunity is also slipping. He’s been benched against left-handed hitters. And he’s now played more games this season hitting 8th in the lineup than batting leadoff. Dwindling opportunity makes him a reasonable candidate to ditch in shallower leagues.
 
jasonkubel.png
Jason Kubel went in the 12th round of average 12-team mixed league drafts. He’s coming off a season where he hit 28 home runs, drove in 103 runs, and nearly hit .300. He’s only put up two homers so far this year and his average his hovering slightly above the Mendoza Line. He’s still owned in nearly every league.
 
Kubel is suffering from a slightly unlucky hit rate, but nothing too drastic for a plodding batter with no speed. His ISO% is way off from .239 a year ago to .121 at the moment. He’s actually hitting more fly balls now than he was a year ago, but fewer of them are clearing the outfield fence. This could be partially the result of bad luck and cold weather, but the question is whether he’ll have a lot of rope to turn things around. 
 
Kubel is known as a horrible fielder, which limits his playing time in the outfield no matter how much Delmon Young struggles. Kubel has been getting plenty of at-bats at DH, but Jim Thome is nipping at his heels. Thome already has four home runs on the season and shares Kubel’s affinity for killing right-handed pitching. For now, we’d hold onto Kubel, but if he starts getting held out of the lineup on a regular basis, he might also be ditched.
alexeiramirez.png
Alexei Ramirez went, on average, in the 10th round of 12-team mixed leagues. He’s coming off a season where he hit 15 HR and had 14 SB at a very thin position. He’s also a guy who has a 20+ HR season on his career ledger. As of now, though, he’s done pretty much nothing yet is still owned in about 80% of leagues.
In 69 at-bats this season, Ramirez has only taken a walk once. That’s extremely worrisome, as his biggest improvement a year ago came from increasing his walk rate from a paltry 3.5% in his rookie year to a more respectable 8.1% in 2009. These days, there’s hardly any good reason why pitchers should feed him a pitch in the strike zone he can hit. He’ll swing at anything.
Alexei is hitting 7th or 8th in the lineup and seems to be a long ways away from making the case he should be batting higher. If he’s really just good for his glove, that hardly makes him much better than the White Sox backup at SS — Omar Vizquel. Of course, Ramirez got off to a terrible start last year too before turning things on. Also, it’s nearly impossible to find a quality SS on the waiver wire. Those are the main factors that would prevent him from being dumped off fantasy rosters en masse. 
 
But Ramirez’s owners may want to watch Chicago’s north side closely. If the Cubs promote super-prospect Starlin Castro anytime soon, and he’s available in your league, it may be time to waive adios to Alexei.
For more on Nate McLouth, Jason Kubel, Alexei Ramirez and other toxic assets, check out Bloomberg Sports’ Fantasy Tools.

(Audio) BTN with Eno Sarris and What is WHIFF Rate?

By Bloomberg Sports //

Listen now! – (loads in new browser)

Behind the Numbers
Hosts: Wayne Parillo and Rob Shaw
Guest: Eno Sarris www.fangraphs.com

Total Running Time: 10:34

High Level Look

  • What is WHIFF
  • All about Mike Pelfrey and Joba Chamberlin
  • Eno’s unique introduction to the world of baseball.

More ways to get Behind the Numbers, talk to us, or just have a good time

For more on the hottest fantasy baseball topics and trends, check out Bloomberg Sports’ fantasy kits.

Garrett Atkins Era Already Over In Baltimore? Rhyne Hughes Promoted

By Tommy Rancel //

The Baltimore Orioles’ signing of Garrett Atkins this off-season was as non-descript of a move as you can get. Yet at the time of the signing, the move struck me as odd. Even before the season started, Baltimore was seen as a fourth- or fifth-place team in baseball’s best division. Therefore, handing nearly $5 million to a below-average corner infielder on the wrong side of 30 didn’t make much sense.

4-27-2010 11-06-36 am.png

Less than a month into the season, the deal looks as bad (if not worse) than it did in December. The 2010 season is very young, but Atkins has a paltry OPS of .564 so far. We warn against small sample size selections, but this looks more like a continuation of a larger decline than statistical noise. Atkins hit his OPS peak in 2006 (.965), but has seen his OPS decline in each season since:

2007: .853
2008: .780
2009: .650

As alarming, if not more, than the OPS decline is the power decline that has accompanied it. Using Isolated Power (ISO), which measures raw power by taking slugging percentage and subtracting batting average, we can see Atkins has been on a sharp decline in power since ’06.

graph.png

Atkins put up a stellar .228 ISO in 2006, but just a .116 ISO in 2009. To date, he is struggling to crack .100 in 2010.

Despite the season being less than a month old, it is pretty clear the Orioles are not going to be contending this year. With that in mind, some younger players in the organization could see significant playing time as the team looks for additional members to add to a strong core of talented players that includes Matt Wieters, Adam Jones, Nick Markakis, Brian Matusz and others.

One of those players who stands to get a chance to prove himself is Rhyne Hughes. Acquired from the Tampa Bay Rays in exchange for Gregg Zaun last summer, Hughes has seen an increase in playing time due to Atkins’ – and the team’s – struggles. Called up just last week, Hughes already has three starts in place of Atkins.

Here are a few things to remember on Hughes: He is not a top prospect. At his age, 26, he’s not much of a prospect at all, and has always been a bit older for his league. More than likely, he won’t be a star at this level, but he wasn’t in the minor leagues either. With that said, despite the lack of hype and fanfare, he has been a fairly solid producer.

In more than 2,200 minor league plate appearances (PA), Hughes has a career slash line (AVG/OBP/SLG) of .279/.349/.457. More recently, he has toiled in Triple-A for Tampa Bay and Baltimore. In 368 PAs at the level, he hit .309/.367/.534, including 15 games this season with a 1.088 OPS.

Hughes is a bit of a hacker (strikeout rate over 30% last year) and doesn’t walk much (less than 10% walk rate in minors), but you’re going to find flaws in most 26-year-old minor leaguers. Meanwhile, the 2010 Baltimore Orioles are in a perfect position to find out if Hughes can have success at this level.

If you drafted Atkins, or picked him up off waivers in a really deep mixed league or AL-only league, drop him if you haven’t already done so. In his place (again, assuming you’re in a deep league) consider Hughes. He should be readily available in most formats and is likely to be given a chance at decent playing time.

If you have an empty spot in an AL-only because a player has recently hit the DL (Nelson Cruz?), give Hughes a flier for a few weeks and see what happens. There isn’t a lot to watch for with the Orioles, but Rhyne Hughes could inject a little excitement to an otherwise ugly season.

For more on Rhyne Hughes and other unlikely sleepers, check out Bloomberg Sports’ Fantasy Kits