(Video) Ballpark Figures: Stock Report

by Jonah Keri //

Ballpark Figures: Stock Report — Bloomberg Television’s Michele Steele talks with Bloomberg Sports Fantasy Analyst Rob Shaw to discuss the bulls and bears on the stock report. Shaw remains bullish on Carlos Lee, despite his poor season numbers. He tells us to keep Pablo Sandoval on the bench temporarily. Finally, Clayton Kershaw is a great buy low option with his ERA more than a run above last season.

BABIP Laggers, xBABIP and Fantasy Rebound Candidates

by Eno Sarris //

We’ve quoted Russell Carlton’s study about the benchmarks when different statistics become significant plenty of times here. In that study, he basically asked how long it took for a statistic to reliably predict itself in one season. Given a batter’s batting average, for example, how many plate appearances does it take until that average predicts his future in-season batting average to a 70% reliability? The answer, in this case, is never. Batting average is one of the most volatile statistics in baseball, and subsequently we’re always chasing those hits in fantasy play.

While batting average itself doesn’t normalize quickly, there are some interesting quirks in the component pieces. For example, line drive rate becomes significant within 40 plate appearances. In other words, the poor-line-drive-hitting players do actually have something to worry about in the early going. While BABIP doesn’t become significant over one season, one of the main components of BABIP – line drive rate – steadies rather quickly.

It follows that players with poor BABIPs are not created equally. A player with a poor line drive rate (the average line drive rate is around 19%) may end the season with a poor BABIP, and therefore a poor batting average. That makes our mission clear. Let’s take a look at the 10 worst BABIPs in the majors, courtesy of FanGraphs. Not surprisingly, the list is filled with under-achievers.
BABIPLaggers.jpg
It’s nice how quickly you can get a sense of which of these players is more ready for a rebound in batting average than the rest. For example, Carlos Quentin may have something to worry about. He’s just not centering the ball, and with a poor line drive this year as well as over his career (15.7%), he may actually end up being a guy with power and poor batting averages once we look back on his full career. That’s another way of seeing how misleading batting average can be – even though we are more than 1500 plate appearances into Quentin’s career, there’s a non-zero chance that he’s better than his .248 career batting average so far. On the other hand, this spider graph from the Bloomberg Sports Fantasy Tools might actually show us who he really is.

QuentinGrab.jpgThere are other names on that list that pop out as ready to bust out. We’ve heard a million times how Mark Teixeira is just a slow starter, he’s got an average line drive rate, and for some reason nearly 80% of his balls in play are becoming outs. That shouldn’t continue, nor should Casey Kotchman continue to be this unlucky on balls in play.

You can use a player’s batted ball profile – their groundballs, flyballs, line drives – and their speed – measured by stolen bases for now – to predict what their BABIP should be. This stat, often called xBABIP, does a good job of pointing out which players are ready for the rebound as well. Here’s the original article, by Peter Bendix and Chris Dutton, that also included an xBABIP calculator.

BABIPxBABIP.jpgCheck out the same 10 players from above, with their batting average, BABIP and xBABIP as columns. Players with the highest xBABIPs on this list suffer from the worst luck and are therefore the best bets for improved batting averages in the future. 

So there you have it. Feel good about Nick Johnson, Teixeira and Kotchman, and worry a little about Quentin and Aramis Ramirez in particular. BABIP is always a useful tool when looking at slumping batting averages, but xBABIP and its component stats help us complete the picture.


Statistics updated through 5/9/10. For more on players with slumping batting averages, check out 
Bloomberg Sports Fantasy Tools.

(Video) Ballpark Figures: Headlines

by Jonah Keri //

Ballpark Figures: Headlines — Bloomberg Television’s Michele Steele talks with Bloomberg Sports Fantasy Analyst Rob Shaw to discuss the latest headlines from the diamond this past weekend. Shaw tells us to pick up the recently perfect Dallas Braden for his starts at Oakland Coliseum. That Bobby Jenks is on the verge of losing the White Sox closer’s gig, while Matt Thornton is a hot pick up. Plus, Shaw tells us that the Phillies and Pirates are cautiously optimistic about the performance of closers Brad Lidge and Octavio Dotel.

Lost: A Look At Scott Kazmir’s Declining Velocity and Decreasing Sliders

By Tommy Rancel //

Last season, Scott Kazmir‘s potential became too expensive for the Tampa Bay Rays. Through injuries and inconsistency, Kazmir was never able to regain his pre-2008 ace form. With more than $20 million guaranteed to the lefty, Rays General Manager Andrew Friedman could no longer bank on just potential.

In a semi-controversial move, the organization traded the most successful pitcher in the franchise’s history to the deeper-pocketed Los Angeles Angels in what many casual fans considered a “salary dump.” However, looking at the quality of the three players Tampa Bay received — Sean Rodriguez, Alex Torres, and Matt Sweeney — and the early-season struggles of Kazmir, it seems the Rays pulled the trigger just in time.

In Los Angeles, Kazmir has reunited with former pitching coach Mike Butcher. Butcher spent  one season with the (Devil) Rays in 2006. It just so happened to be one of Kazmir’s best seasons; his 3.24 ERA that season is still a career best. Looking at fielding independent pitching (FIP), which takes defense out of the equation, instead measuring walks, strikeouts and home runs, his 3.36 mark that season was a career best as well.

There was hope that once re-united with Butcher, some of the inconsistencies that plagued Kazmir in 2008 and 2009 would disappear. More importantly, there was hope that his once dominant slider as well as his mid-90s fastball would reappear.

The early returns on Kazmir in Los Angeles were very good. In six starts down the stretch last season, he went 2-2 with a 1.73 ERA and 2.93 FIP. He used his slider a healthy 19.1% of the time and his fastball velocity jumped from 90.7 with the Rays to 92.5 with the Angels; potential signs that Kazmir might put it together in 2010.

Unfortunately, things are not going according to plan this season. Despite his respectable 2-2 record, Kazmir has a 7.11 ERA and a 6.43 FIP thus far. A former American League strikeout champion (2007), Kazmir is on pace to strike out fewer than eight batters per nine innings for the second straight season. While his strikeouts have slightly faded, his walk rate is climbing. He has handed out 16 free passes in just 25.1 innings – a walks per nine innings rate of 5.7.

Kazmir is throwing his fastball around 90 mph right now and is using his slider just 8.2% of the time – a career low. In a slight bit of good news, Kazmir has developed a pretty good change-up. However, between the change-up and fastball, he’s basically a two-pitch starter right now.

kazvelo.png

It should be noted that Kazmir did battle with a hamstring and (another) arm injury this spring, but one would think the Angels wouldn’t send him out there if he wasn’t 100%. After all, he is still owed more than $20 million. Whether the problem is physical (meaning delivery) or mental, Scott Kazmir just isn’t very good right now.

If you drafted Kazmir, hopefully you took past history into account and didn’t select him with the intent of anchoring your rotation. Despite the ups and downs of the past few seasons, he has won double-digit games five straight years. With two wins already, he should get there again. Meanwhile, if you’re expecting the Kid K of 2007, you’re going to end up disappointed. At this point of the season, it is too early to dump him outright, but it may be time to take a page out of Andrew Friedman’s book, and get what you can in a trade instead of banking on potential that may never pay off.

For more on Scott Kazmir and the Los Angeles Angels, check out Bloomberg Sports’ fantasy kits.

Johan Santana vs. the Phillies

By BloombergSportsPro //

Johan Santana had one of the worst starts of his career a couple of nights ago, giving up 10 runs in 3.2 innings pitched against the Philadelphia Phillies. I’m going to use the Bloomberg Sports Professional tool to take a look at his start and see if anything stands out as the cause of Santana’s struggles. Most of the analysis will be based on pitch f/x data, one data source which the tool integrates and puts into a more useable, visual format.
One issue which has come up over the last few years, when talking about Santana, is his velocity. While Santana used to sit in the low 90s and touch the mid 90s his fastball velocity has dipped significantly over the past few seasons. In his last start Santana threw seventy seven fastballs and pitch f/x only picked up two with a release speed of over 90 mph.

Given his recent velocity troubles this was the first thing I checked in the tool. It seems, however, that Santana’s velocity was much improved in Philadelphia compared to his previous start. Santana threw 41 fastballs against the Phillies and 23 had a release velocity of over 90 mph. This rate of 56.1% of his fastballs being over 90 mph is just about the same as his 2009 season where 958 of the 1603 fastballs (59.8%) were measured at over 90 mph. Given the fact that Johan tends to build velocity as the season goes along this should actually be an encouraging sign for Mets fans.

During the game the announcers brought up the issue of Santana’s pitch selection. Primarily they were wondering why Johan was relying exclusively on his fastball and change-up. I decided to examine Johan’s pitch selection to see if this might be the cause of his struggles.

santanatable.png

While Santana only threw 7 breaking balls it doesn’t seem like his rates were different against the Phillies compared to the previous two seasons. If anything he was throwing sliders slightly more frequently. This makes sense, as the Phillies have more left-handed hitters than most teams and Johan generally throws his slider to lefties and his change-up to right-handed batters.

It seems as though we can rule out velocity and pitch selection as potential causes for Santana’s struggles in Philadelphia. The third factor which I wanted to look at was pitch location. Santana is generally thought of as one of the most accurate and aggressive pitchers in baseball, throwing about 55% of his pitches within the strike zone, consistently one of the highest rates in baseball. Santana had 48 strikes and 23 balls yesterday (this includes swinging strikes not just balls in the strike zone), almost exactly what one would expect, so it doesn’t seem like he was having problems throwing strikes.
Throwing strikes is only one part of the equation in control, though. A pitcher must hit the right spots in order to succeed. Santana gave up 5 extra base hits during last night’s game. Here are the locations of the pitches which the Phillies hit hard.

santana1.png

Four of the five extra base hits which Santana allowed were on fastballs (the red markers.) All four of those fastballs were right over the heart of the plate and at least waist high. The fifth hit, Ryan Howard’s Home Run, came on a change-up which was low and away.

Every pitcher throws some pitches right over the heart of the plate. Did the Phillies do an especially good job of taking advantage of Johan’s mistakes? Let’s take a look at the location of every pitch which Santana threw last night.

santana2.png

Santana threw a lot of pitches right down the middle yesterday. Out of the 66 pitches tracked by pitch f/x 17 of them (25.8%) were located right in the middle of the strike zone. This includes 13 of the 41 fastballs (31.7%) which he threw. How often does Santana usually throw pitches in that zone?

santana3.png

The image above shows us the location of every pitch which Santana had thrown in 2010 before the game against the Phillies. Santana threw 78 of his 514 pitches (15.2%) in the center of the strike zone, including 63 of his 308 fastballs (20.5%.) For the 2009 season Johan threw 14.5% of his pitches and 16.3% of his fastballs in this section of the strike zone. While Johan was able to throw a similar number of pitches in the strike zone he did not have the kind of accuracy within the strike zone which he relies on to get batters out. By throwing so many pitches right down the middle, Santana gave the Phillies an opportunity to put good swings on pitches. They obliged, crushing four home runs and a double.

Johan Santana is not the power pitcher he once was. He relies on his accuracy and intelligence as a pitcher to consistently get batters out. When his accuracy falters, as it did in Philadelphia, he can be very hittable. Santana’s future success will depend heavily on his ability to locate his pitches. He has demonstrated control on par with the best pitchers in baseball over his career so it seems way too early for Mets fans to worry. The fact that Santana’s velocity increased and that he was throwing his usual selection of pitches are both good signs. If you want to know whether Santana will bounce back you now know where to look – the location and quality of strikes which he is throwing.

(Audio) BTN Talking UZR with Mitchel “MGL” Lichtman

By Bloomberg Sports //

Listen now! – (loads in new browser)

Behind the Numbers
Hosts: Wayne Parillo and Rob Shaw
Guest: Mitchel “MGL” Lichtman of Inside The Book and UZR creator

Total Running Time: 10:34

High Level Look

  • Working with the Cardinals
  • The recent “controversy” regarding UZR and Jason Bay
  • The future of UZR

More ways to get Behind the Numbers, talk to us, or just have a good time

For more on the hottest fantasy baseball topics and trends, check out Bloomberg Sports’ fantasy kits.

How Strand Rate Contributes To Pitcher’s Luck

By Eriq Gardner
All good pitchers are alike; all unlucky pitchers are unlucky in their own way.
A
good pitcher will usually strike out a lot of batters, limit the number
of batters put on base via walks, and induce a lot of ground balls.
An
unlucky pitcher can be unfortunate in a number of ways: The quality of
opposition. The ballpark. A high percentage of balls hit into play
finding the gaps between fielders. A high percentage of fly balls
ending up as home runs. And perhaps the most under-appreciated form of
misfortune — a low strand rate.
Some of this
is the pitcher’s fault. If a pitcher is pitching to contact, a lot of
balls are going to go for hits. It stands to reason that some of those
hits will be back-to-back-to-back, ending up as earned runs. But some
pitchers are lucky enough to space out those hits as to avoid damage.
And some pitchers play on teams that have relievers who can come into
the game and clean up a mess.
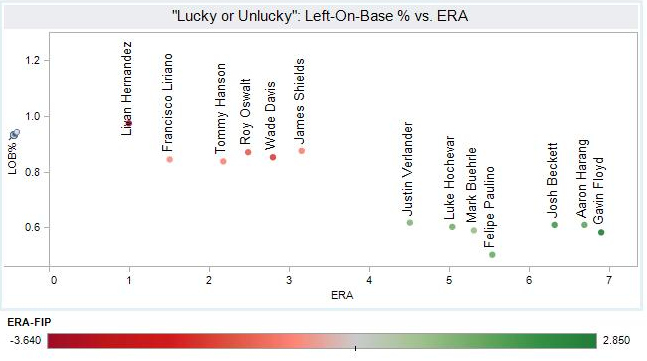
Research shows
that the major league average for strand rate (also known as LOB%) is
about 72%. Those who are much higher are getting lucky. Those who are
much lower are unlucky.
Here’s a graph that
shows some pitchers who are relevant in most fantasy leagues who to
date who are well above or well below the norm:
strandrate.png
Now, a closer look at the pitchers.
First the “lucky” bunch:
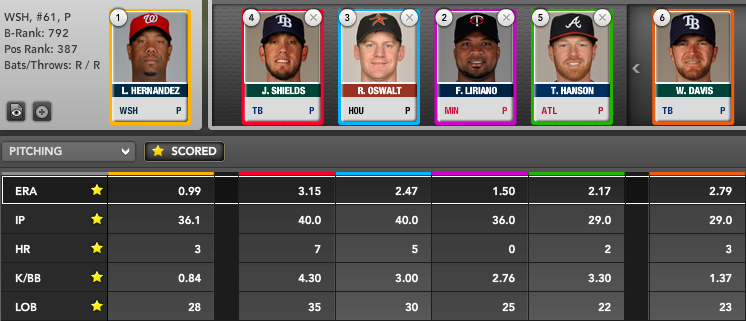
strandlucky.png


Livan Hernandez:
It doesn’t take a rocket scientist to figure out this grizzled veteran
doesn’t deserve an ERA under 1. He’s a pitch-to-contact guy who has
always been prone to giving up home runs. Much of his great fortune
this year is based on a hit rate under 19%, when the norm is more like
30%. But Hernandez has also been counting his blessings about the
batters he has allowed on base. Less than 3% have scored, the lowest
rate in baseball.
Roy Oswalt: Oswalt’s
strand rate of 87.2% ranks near among the highest figures in the
National League. But his home runs allowed rate is worse than the
average pitcher (without an excessively high HR/FB rate to suggest
that’s a fluke) and he’s also getting lucky on hit rates. He may be
sporting a 2.48 ERA at the moment — and many might assume he’s back to
dominant form — but Oswalt looks more like a good but not quite great
pitcher.
Francisco Liriano: The Twins ace is
doing almost everything right this year. He’s striking out a batter per
inning. He’s slashed one full walk per 9 IP off last season’s free pass
rate. He hasn’t allowed a home run yet. But still, Liriano figures to
regress at least somewhat, given his 84.6% strand rate; the Twins
somewhat iffy bullpen raises the risk of regression. Liriano still
figures to have strong numbers. Just not a sub-2 ERA.
Tommy Hanson:
Striking out more than a batter per inning solves most problems, such
as a mediocre walk rate. Hanson hasn’t allowed many home runs either,
but he has an 84% strand rate, which means a bit of regression
forthcoming.
Wade Davis: The rookie has
a poor strikeout-to-walk rate. His low hit rate and high strand rate
will make that 2.79 ERA go up quickly. His xFIP is a scary 4.59 at the
moment.

James Shields: Shields’ strand rate is a sky-high 87.7%.
He’s also surrendered seven home runs in his first 40 innings pitched.
So far, those home runs aren’t killing Shields, because he’s giving
them up when opposing batters aren’t on base. And when opposing batters
do get on base, he’s getting out of the inning without much
damage. On the plus side, though, the Tampa Bay pitcher is whiffing
9.68 batters per 9 IP, tops in
the American League. His 2.25 per 9 IP walk rate also ranks among the
top 10 in baseball.

Shields’ strand rate points to a pitcher who’s had a lucky season. But
the Rays righty has also posted a flukishly high 16.6% HR/FB rate.
Shields’ ERA is an impressive 3.15; his xFIP is also 3.15, suggesting
that his good and bad luck are evening out. He’s the outlier of the
strand-lucky group.

Now the “unlucky” bunch:
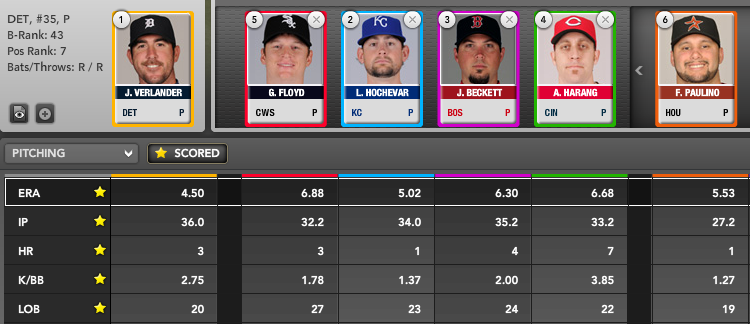
strandunlucky.png

Justin Verlander:
Striking out a lot of batters? Check. Not walking too many batters?
Check. Not allowing an obscene amount of home runs? Check. How’s his
hit rate? Also reasonable. Despite all that, Verlander has a 4.50 ERA,
when his FIP is just 3.34. A low strand rate (61.9%) is owed much of
the blame. If the Tigers can continue to play strong defense and throw
up good relief pitching numbers, that would only help Verlander even
more.

Gavin Floyd: Few pitchers have hurt owners
worse this year than Floyd, who currently sports an ugly 6.89 ERA. But
his strikeout rate is actually better than his career average. He’s
also allowing fewer home runs per inning than usual. He’s become a
little more friendly to batters in the walks department, but it doesn’t
explain the wide gap between his ERA and his respectable 4.30 xFIP. We
can at least pin much of the blame on misfortune from a 58.4% strand
rate, seventh-worst in the majors.
Luke Hochevar:
The Royals youngster doesn’t have a particularly good strikeout-to-walk
rate, but he’s fantastic in keeping the ball on the ground and in the
ballpark. That’s because he’s been doubly cursed with a high BABIP and
a low strand rate. Once those hit balls go for outs more often, and
runners become stranded on base, his ERA will come down. One caveat,
though: Hochevar owes much of his low home run rate to a microscopic
3.3% HR/FB rate, making his 4.49 xFIP not far from his5.03 ERA.
Josh Beckett: We can’t sugarcoat this — Beckett’s skills have declined (at least on the evidence so far) and
he’s getting unlucky too. The Red Sox ace is whiffing fewer batters and
allowing more walks than in past years. But his hit rate is high and
strand rate is low as well. There’s a lot of reasons why Beckett has a
6.31 ERA. A 61% strand rate just exacerbates the situation.
Aaron Harang:
A pitcher who allows seven home runs in just over 33 innings is asking
for trouble. But six of those home runs have come with the bases empty.
That’s about the only piece of good luck he’s seen. Harang has been
cursed in a number of ways: A higher-than-normal HR-to-fly-ball rate, a
high BABIP, and of course, a low strand rate. There’s good reason to
expect much better from Harang going forward: His ERA to date is 6.68,
vs. a solid xFIP of 3.83.
Felipe Paulino: The Astros pitcher has
cut his home runs allowed and is striking out 7.48 batter per 9 IP –
down from last year but still above league average. His two biggest
downfalls are a terrible 5.86/9 IP walk rate and a 50.4% strand rate,
worst in the majors. That strand rate should improve dramatically. But
Paulino also needs to get his control in check to be
worth rostering in mixed leagues.
(statistics as of 5/5/10)
For more on pitchers with high or low strand rates, check out Bloomberg Sports Fantasy Tools

Adrian Beltre, Batting Title?!

By R.J. Anderson //

Nobody could blame Adrian Beltre if he wanted to distance himself from the 2009 season as much as possible. Not only did he endure a horrendous offensive season in which he posted a .683 OPS, he also suffered an injury to a certain male region that should never be used in the same sentence as the term “ruptured”. Nonetheless, Beltre became eligible for free agency and joined the Boston Red Sox. A stronger supporting cast figured to help his counting stats, while a far friendlier ballpark for hitters figured to boost his overall offensive production.

Thus far, Beltre is hitting .343 AVG/.375 OBP/.467 SLG. Previously, Beltre posted a batting average above .300 exactly once in his 12-season career. Meanwhile, his career Isolated Slugging (ISO, slugging average minus batting average) is .182, much higher than this season’s .124.

Beltre’s .386 BABIP is certainly the highest of his career, and miles away from his .292 career mark. Of Beltre’s 36 hits, only nine have been of the extra base variety. Putting up 75% singles looks more like a Nick Punto season, not the kind of numbers you expect from a player who hit at least 25 home runs each season from 2006 through 2008, with 252 career homers.

What gives? Beltre’s 4% HR/FB ratio is a career low, even worse than his 5.6% in 2009. This seems unlikely to continue to be the case. In past seasons at Safeco Field – a park that strongly curbs extra-base hits by right-handed batters – Beltre was still able to launch more than 10% of his fly balls over the wall. A move to Fenway Park – an extra-base hit paradise for righties who can get the ball up in the air and deep – Beltre should not see his power disappear.

beltre10.png

As it stands, Beltre is second among third baseman in hits and second in batting average, behind division rival Evan Longoria. The season is a month old and odds are Beltre is going to finish with a higher batting average than originally expected. But there’s little reason to believe Beltre’s skill set has completely morphed from hulking slugger to Ichiro Suzuki clone. Adjust your expectations accordingly.

For more on Adrian Beltre, check out Bloomberg Sports Fantasy Tools. 

var OutbrainPermaLink=’http://bloombergsports.mlblogs.com/wp-content/uploads/2010/05/beltre10-thumb-550×131-20102913.pngarchives/2010/04/chris-volstad-and-pitching-truths.html’;
var OB_Template = “mlbblogs”;
var OB_demoMode = false;
var OBITm = “1241712535489”;
var OB_langJS =’http://widgets.outbrain.com/lang_en.js’;
if ( typeof(OB_Script)!=’undefined’ )
OutbrainStart();
else {
var OB_Script = true;
var str = ”;
document.write(str);
}

(Video) Ballpark Figures: Head-to-Head

by Jonah Keri //

Ballpark Figures: Head-to-Head — Bloomberg Television’s Michele Steele talks with Bloomberg Sports Fantasy Analyst Rob Shaw to preview the exciting weekend in Major League Baseball. The topic of choice is the match-up between the Red Sox and Yankees. Shaw tells us that Marcus Thames and Adrian Beltre are major sleepers to keep an eye on, while Alex Rodriguez is bound to get hot.

Assessing Martin Prado’s Value

By Tommy Rancel //

In this era of advanced statistical analysis, some of baseball’s traditional stats have become less relevant when evaluating players. One of those metrics is batting average. That’s not to say batting average isn’t useful, or isn’t a sign of hitting ability, but it doesn’t tell a complete story. Plus, there are other statistics like on-base percentage – or weighted on-base average for more advanced followers – that are more useful.

The value of batting average has changed in real life evaluations; on the other hand, in fantasy baseball, one of the game’s simplest statistics still holds weight. As an owner, you may be able to leverage a high batting average in a trade that nets a bigger piece to your puzzle without sacrificing an important piece of your team.

Martin Prado is a prime example of a player who has his fantasy value tied into his batting average.

In real life, Prado is a good player. With his role increasing over the past few years, he has put up very good numbers from the middle infield position. His career slash line (AVG/OBP/SLG) is a very respectable .310/.364/.451 and his defense is generally accepted as average. Without much power or speed, but a good average, Prado looks like a young Placido Polanco.

3312_1176_2B3B_aseason_full_0_20100504.png

Graph courtesy of Fangraphs.com

Prado’s efforts have largely gone under the radar because he doesn’t possess a hulk-smashing power stroke, nor is he considered a defensive dynamo. Still, in 2010, Prado has gotten off to another good start. He is hitting .339/.397/.459 thus far, with the bulk of his value again in that batting average.

Currently, Prado has a batting average on balls in play (BABIP) of .382. Compare that elevated figure to the average ballplayer’s BABIP of around .300. For his career, Prado has maintained an elevated BABIP of .341; even at that level, a .382 mark suggests that some batting average regression will be coming.
 
Beyond the potential BABIP regression, let’s take a look at the types of hits Prado gets. He is not a power hitter, although he did belt 11 home runs last year. Outside of those 503 plate appearances (PA) in 2009, he has four home runs total in his other 482 PAs – including one home run in 117 PAs this season. He does have 70 career doubles and five triples; however 68% of his 276 career hits have been singles. This season, 26 of his 37 hits have gone for one base.

Even if the regression happens, you’ll likely be left with a good (but not great) hitter. If you’re already looking good in the batting average category, Prado could be a valuable trade piece to cash in for power or steals – commodities he lacks.

prado.png

In a standard 10-12 mixed league, Prado’s average could be used to net a slumping/slow-starting power-hitter who will not only provide home runs, but RBI as well.

A prime target would be Hunter Pence of the Houston Astros. Here at Bloomberg Sports, we have already talked about Pence being a slow starter; 2010 has been no different. We also noted that Pence usually gets going around this time and doesn’t look back. With back-to-back 25 home run seasons under his belt, there is nothing to suggest that the 27 year-old can’t produce the same in 2010 once his bat heats up.

Alternatively, you could keep Prado as a batting average buffer and go after a high-power, low-average hitter. Carlos Pena and his .200 batting average could make a strong target. The Rays first baseman is blessed with 35-homer power and hits fifth in one of the most dynamic lineups in baseball, making him a great candidate for big counting stats.

There is no rush to trade Prado. The in-season updated projections from ZiPS (for more on ZiPS click here) have him hitting .311/.365/.439 with eight home runs in 2010. However, if you can leverage his batting average in a trade and pick up a struggling player like Pence, who is projected to hit 22 home runs and drive in 76 runs by the same projection system, it might be something worth looking into. Or keep Prado and go after a Pena type. Either way, you’ve got options.

For more on Martin Prado and high batting average players, check out Bloomberg Sports’ Fantasy Kits.