Joe Mauer and His Power Outage

By Bloomberg Sports //

Last season’s AL MVP, Joe Mauer, has seen his home run numbers drastically decline this season as compared to his 2009 level. Mauer hit a career-high 28 homers during his MVP campaign, but so far this year he has hit only two.
Using Bloomberg Sports’ statistical tools, we can see that Mauer’s home run output both in 2009 and in 2010 were uncharacteristic, and that his power numbers should regulate somewhere in between the two.

First, it must be mentioned that Mauer’s OPS in 2009 was unusually high for his career, and a neutral observer might conclude that 2009 was a fluke. Others could argue that this surge had to do with natural age progression, as he reached the age of 26, a milestone at which many players begin to peak. Thus, despite Mauer’s current career OPS of .887, it could be argued that his 1.031 2009 OPS would have some staying power. Mauer’s monster season prompted the Twins to hand him an eight-year, $184 million contract extension in March.

Mauer’s two homers this year-to-date have thus raised concerns in Minnesota. We can point to his fluctuating home runs per flyball rate as a cause of this season’s power outage – as well as Mauer’s 2009 outlier season. From 2005 to 2008, that rate ranged from 6.5% to 10.8% — league average typically hovers around 10%. However, in 2009, Mauer’s HR/FB rate jumped to a stratospheric 20.4%. Thus maybe this shift, rather than indicating anything in particular about Mauer’s game, indicates that a lot of Mauer’s power in 2009 was the result of a statistical variation. If this dramatic increase had been accompanied by a drastic change in body type it would be understandable, but Mauer’s body did not noticeably change.

mauer1.JPG

This season, Mauer’s homerun per fly ball out rate has regressed to just 5.7%, a career low, but also closer to the pre-2009 range. The numbers clearly point to 2009 being an outlier in this respect. Granted, a couple of unmentioned variables might be pulling down Mauer’s HR/FB rate this year. One, the Twins’ move to Target Field from the Metrodome might be affecting his power numbers, especially through the early, colder-weather months of the season. Second, pitchers might be attacking Mauer differently this season, following his ’09 power outburst. Let us explore these two possibilities.

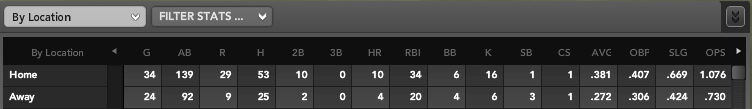
Mauer’s new home, Target Field, has been the third-worst ballpark for home runs, in front of only Citi Field and the Oakland Coliseum, according to ESPN.com’s MLB Park Factors. However, through just over one-third of the season, it is tough to say that this phenomenon is reliable or that it will remain constant. After all, it typically takes three years before you can properly trust a given stadium’s park factor. Meanwhile, Mauer’s previous home, the Metrodome, played as roughly home run neutral. The dimensions of the two fields are very similar, so expect Target Field to be less home run-stubborn than it currently is, especially in the warmer summer months. To date, Mauer’s OPS is 80 points lower at home than away.

Maybe pitchers are attacking Mauer differently too. This argument could potentially explain some of the catcher’s power struggles. Pitchers, in fact, have been unwilling to throw him fastballs in certain counts, and seem to have replaced them with changeups, and occasionally curveballs. In 2009, on 0-1 and 2-2 counts, Mauer saw a majority of fastballs. However, this season, in the same counts, he’s seen a fastball only about one-third of the time. This change by the pitchers seems smart, as Mauer had a lethal 1.077 OPS against four-seam fastballs from 2006 through 2009. Meanwhile, he now sees almost three times as many curveballs on the first pitch and in 2-2 counts, according to Bloomberg Sports tools, when compared to 2009. This adjustment by pitchers seems appropriate, as Mauer had a .483 OPS against curveballs dating back to ’06. Lastly, Mauer has seen more changeups in 1-2, 2-1, and 2-2 counts, although he has fared well against the changeup in his career, so this adjustment should have had no effect.

mauer4.JPG

Target Field’s low home run rate and the new approach by pitchers may be hurting Mauer’s home run numbers. But the statistical variation in his HR/FB rate also helps explains the drastic difference between 2009 and 2010. That rate suggests that Mauer’s MVP-type numbers may have been affected by a statistical outlier, and that fans and teams may have to reassess their expectations for Mauer’s power numbers. In regards to how pitchers are approaching Mauer, it seems unlikely that the recent adjustments can explain this year’s low home run total, as he has been a top player in the league since 2004, and pitchers have been adjusting to his tendencies every year. Meanwhile, Target Field has been playing like a large shopping mall – but it does not explain Mauer’s low road home run total, or the fact that he has yet to hit any homers at home.

Expect a middle ground to emerge between the home run binge Mauer showed last season and the drought he’s experienced in 2010.

Should You Hold Onto Wandy Rodriguez, Rich Harden, and Ricky Nolasco?

By Eriq Gardner
Time to take a look at some more “toxic assets,” or players who may have been highly drafted but have done little so far this season to warrant fantasy roster spots, besides a recognition of past accomplishments and potential upside.
Deciding when to cut bait on these underperforming players often requires a gut check. But with so much potential help on the waiver wire in standard leagues, teams can only afford so much latitude in giving players time to get their act together.
Let’s examine some pitchers who are candidates for dumping.
wandy.png
Wandy Rodriguez has been a tremendous disappointment this season. He entered the year as a borderline fantasy ace, with solid peripheral skills. In 2009, he posted 14 wins, a 3.02 ERA, and a 1.24 WHIP. He backed those numbers up with a strong strikeout rate (193 in 205 IP), nice command (more than 3 Ks for every BB), and a respectable ground ball rate (45%).
Right now, he’s showing just 3 wins, a 5.60 ERA, and a 1.67 WHIP. He’s gone from a potential #1 on a fantasy team to just the third-based SP on the awful Houston Astros, behind Roy Oswalt and Brett Myers (perhaps behind Felipe Paulino too). What’s especially concerning about Rodriguez is the big dip in his strikeout rate: It’s gone from 8.45 K/9 IP to 6.22 this season. Most recently, he’s shown modest improvement in striking out batters, but unfortunately, it’s gone hand-in-hand with rising numbers of walks and home runs allowed. His xFIP is a pedestrian 4.48 at the moment – much better than his ERA, but still nowhere near his former ace status.
Rodriguez has never been a hard thrower, averaging just over 89 MPH on his fastball throughout his career. Velocity readings show not much change this year, and other than an increased use of his changeup, there doesn’t seem to be that much difference in his pitch selection. Instead, his buckling curveball has become a lot less effective this year, as word spreads that he hasn’t been able to locate it well. 
Perhaps this is a minor adjustment, but if it was so easy, he probably would have made it already. Rodriguez’s next two games are both at home, against Texas and San Francisco. He’s traditionally played much better at home. He’s probably a hold for at least another couple of games, but if he can’t turn in a solid game against the weak-hitting Giants at home, he deserves to be cut.
harden.png
Rich Harden recently went on the injured list, which in some ways may have been good news for some owners with DL roster allowances. Before succumbing to the inevitable injury, Harden was terrible, posting just 3 wins, a 5.68 ERA, and a 1.68 WHIP. 
Harden wasn’t great in 2009 with an ERA over 4 and a WHIP at 1.34. But he performed better than his superficial stats may have suggested, striking out nearly 11 batters per 9 innings and posting a solid xFIP of 3.70.
This year, Harden’s strikeouts are down to 8.17 Ks per 9, which would be a strong enough rate if not for the fact that his command has been truly lousy. He’s walking nearly 6 batters per 9 IP, the worst rate in the major leagues. Harden is also allowing more HRs (nearly 2 per 9 IP) and it doesn’t take a rocket scientist to figure out that putting men on base by walk and then allowing HRs is not a formula for success.
If he wasn’t on the DL, we’d recommend he be dropped. After all, the injury-prone player misses a lot of time anyway and plays in one of the friendliest hitters’ environments. If fantasy teams have room to stash him on DL in hopes of a turnaround after getting healthy, that’s fine. However, he shouldn’t be given much rope even when he does return.
nolasco.png
Ricky Nolasco hasn’t won many fans this season with 5 wins, a 5.05 ERA, and a 1.38 WHIP. 
He’s also no stranger to bedeviling fantasy owners. Last season, his ERA was in the 9’s in May before he got demoted to the minors. Nolasco eventually brought his ERA down to 5.05 by season’s end; his xFIP was an outstanding 3.28.
But last season, Nolasco was striking out more than a batter per inning and flashing elite command. In 2010, his strikeout rate has dipped down to 6.6 K/9 and his flyball and HR rates have both climbed. According to an analysis by Mike Axisa at Fangraphs, the problem seems to stem from lost movement on his pitches, which has made them easier for batters to connect.
Nolasco has a neutral upcoming schedule, with battles against the Rangers, Orioles, and Mets. It’s also important to note that Nolasco could be a trade candidate for the Marlins, which may take him out of the stadium that ranks fourth-best for hitters this season. For now, Nolasco shouldn’t be dumped, but his leash is definitely growing shorter.
For more on hold-or-dump toxic assets, check out Bloomberg Sports’ Fantasy Tools

Fantasy Tumbleweeds: Who Will Be the Arizona Closer?

By Eno Sarris //

Going into this season, Chad Qualls was a solid sleeper for saves. He had never had an ERA above 3.76, or a WHIP above 1.27, in his entire career since his 2004 debut with the Astros. If you prefer more advanced stats, he had just finished a three-year stint in which he had struck out more than eight batters per game and walked fewer than two and a half. His groundball rate had never fallen below 56.7%, making him one of the most extreme worm-burners in the game.

He may not have been in a large media market, and he didn’t put up double-digit strikeout rates like some of the more prominent closers, but Qualls looked solid and there was no immediate threat to his role in the bullpen. In some ways, not much has changed, though he’s now derided instead of (mildly) celebrated.

Qualls still has a strikeout rate above average for all pitchers – his 7.44 career K/9 is above the major league average, which hovers between 6.6 and 7 K/9. This year, his 9.27 K/9 is even above average for a reliever. If you take all appearances by all relievers this year, the major league average K rate for relief pitchers is 7.78. There’s a clue here about Qualls’ stuff: In an average year, he only strikes out batters at about an average rate. But he’s bettered that this year, so that’s not his ‘problem.’

If you look at Qualls xFIP (expected fielding independent pitching, which uses aspects of the game controlled by the pitcher and strips out batted ball and home run or park effect luck and produces a number on the ERA scale), he’s had a typical season. He now owns a 3.55 xFIP, right near his strong career number (3.45). So why has Qualls struggled from a fantasy perspective? Check out how bad it has been compared to your top 10 major league closers, by the Bloomberg Sports Fantasy Tools spider graphs on the right.QuallsGrab.jpg 

One thing that comes to mind is that pitchers with high groundball rates are at risk of giving up more seeing-eye singles. This year, a high number of batted balls he has given up have either been line drives (22.5%) or found its way to undefended grass: Qualls’ .474 batting average on balls in play (BABIP) is the highest for any pitcher with at least 10 innings pitched. To make matters worse, Qualls is only stranding 51.8% of runners, vs. league average of about 70%.

The standard refrain might be to say that he’s been wildly unlucky and that he will be fine. As a relief pitcher, there’s no way he’ll pitch enough innings for his numbers to regulate by year’s end. From now until the end of the season, his luck could well turn. But the Diamondbacks might not be patient enough to let Qualls spring back into form – especially not in a rebuilding season, when they might explore younger options instead and possibly trade Qualls to a contending team looking for help in the set-up role.

So we are left with the fact that his future is uncertain, despite an inkling that his true talent level is by far and away the best in that Arizona bullpen. It’s a poor pen – the worst in the majors by ERA with a 7.33 ERA (Milwaukee is second with a 5.86 number), and the heir apparent, Juan Gutierrez, has had issues of his own. Gutierrez is only coaxing 27.5% groundballs, and so has given up an astounding 4.22 HR/9 so far. He has a lot of work to do to regain the Closer of the Future mantle.

Remaining in the quiver are a duo of underwhelming pitchers at different ends of their careers. Aaron Heilman and Esmerling Vasquez hold the dubious distinction of the being the only two with ERAs under 5.00 in that pen. When manager A.J. Hinch said he was going to explore other options at the closer position, somewhere inside he probably wondered which options he had, because even these two players are flawed.

Since the team may look to rebuild, it’s worth looking at the younger of the two ‘options.’ Vasquez is a former starter who has shown flame-throwing ability in the pen (94.2 MPH fastball over his short, two-year career), but hasn’t been able to harness his fastball/change arsenal. His 4.88 BB/9 career is almost a full run worse than the average reliever this year (3.94 BB/9). Some wildness might play in the pen (see the higher walk rate for relievers), but this is pushing it. Then again, he gets almost 10% more groundballs than Gutierrez, so he’s got that going for him.

Heilman, on the other hand, doesn’t strike out batters at an average rate, at least this year. Not only is his strikeout rate below-average (7.22 K/9), but he doesn’t supplement it with a good groundball rate like Qualls does (27.1% this year, 43.6% career). He hasn’t had an xFIP under 4.00 for four years. He’s stranding 85.4% of his batters and giving up an unsustainably low 7.3% home runs per fly ball rate (that number trends towards 10% across baseball, is 10.4% for Heilman’s career, and Heilman plays in a home-run friendly park that augments home runs by 21.5%).

But Heilman is a veteran with an ERA under 3.00, so he may get a shot. Vasquez is the more interesting option for the DBacks if they are going to keep an eye on the future, and Qualls is AZBully.jpgthe one who probably deserves the spot based on his underlying skill set and track record. Still, take one last look at how bad this bullpen is, with stats from Fangraphs.com, and you’ll see Hinch’s problem in full focus (click for the full image).

Fantasy owners might as well act like they were in control of the big league club here. If you’re building for the future, you might want to pick up Vasquez and see if he can become the future closer. If you’re playing for now, you might as well keep Qualls and hope his true talent wins out in the end. If you are scratching for any save, any save at all, and have a roster spot to burn – Heilman might be worth a speculative pickup.

Update: Today, Mr. Toad’s Wild Ride continued for Conor Jackson as he was traded to the Oakland Athletics. Coming back is Triple-A closer Sam Demel. Demel has had some control issues in the past (4.5 BB/9 career in minors), but has cut those walks this year (2.8 BB/9) and has strikeout stuff (10 K/9 career in minors). He could very well be a candidate for saves this year, but will not only have to be processed and called up, but he will have also have to show he can replicate his success in the major leagues before he can be taken very seriously. Deep leaguers competing for the title this year with minor league spots to burn should take notice.

For more on would-be closers like Esmerling Vasquez, Aaron Heilman or Chad Qualls, check out Bloomberg Sports’ Fantasy Tools

Vladimir Guerrero Discovers Fountain of Youth In Arlington

By Tommy Rancel //

A year ago, it seemed Vladimir Guerrero‘s days of being a feared power hitter were numbered. Through a combination of injuries and age, Guerrero’s power numbers took a hit in 2009. He hit 15 home runs and totaled just 31 extra-base hits as injuries limited him to 100 games.

His 2009 slugging percentage of .460 along with his .164 ISO (Isolated power is slugging percentage minus batting average) were the lowest totals since his rookie season of 1997. With limited defensive ability, and a seemingly declining bat, Guerrero took a one-year deal with the Texas Rangers.

The deal has proved to be a blockbuster so far. Vladdy got off to a slow start with the Rangers – at least in terms of power. His .333 batting average (AVG) in April was very good, but he hit just two home runs. His slugging percentage was right back in the .460 area. An OPS of .851 is still good production from the DH spot, but April proved to be just the opening act.

In May, Guerrero exploded for a .330 average, with 10 home runs and 31 RBI. His slugging percentage for the month was a stellar .633 in 109 at-bats. In June, he has added two more home runs and is once again slugging over .630.

vladslg.PNG

So what is behind Guerrero’s return to the top of the power-hitting food chain?

Our first guess would be health. Guerrero missed a game earlier this month after taking a foul ball off his eye, but the back problems that have plagued him throughout his career have been quiet in the early part of 2010. He has played in 58 of the Rangers first 62 games and has even logged some outfield innings along the way.

If you are looking for a fluke in his overall power numbers, you won’t find one. His .568 slugging percentage is identical to his career number. His .230 ISO is slightly lower than his .247 career average. In terms of batted ball data, his .322 batting average on balls in play (BABIP) is right in line with his career .319 BABIP. His line drives, groundballs, and flyballs are all within 2-3% of historical values.

Although Guerrero is swinging at 50.2% of pitches outside of the strike zone, he is striking out just 9.5% of the time – a figure that represents the second-lowest single-season total of his career.

While luck doesn’t seem to be a factor for Guerrero, the Rangers Ballpark in Arlington certainly is. Outside of being healthy, playing his home games in the offensively-friendly park has been the biggest reason for Vlad’s resurgence. Guerrero’s new home currently ranks in the top three among American League stadiums in runs scored and home runs.

In 98 plate appearances on the road, the Rangers DH is hitting .272/.306/.424. At home, the 35-year-old is hitting .381/.407/.669 with 10 of his 14 home runs and 10 of his 12 doubles in 150 PAs. In fact, a ******** 20.4% of the flyballs he hits in Arlington have left the yard.

vladsplits.PNG

In general, it is good to exercise caution when dealing with such extreme splits, however, because of the park’s offensive nature, Guerrero could very likely sustain the power barrage in Texas. With 47 home dates remaining, Guerrero could put up 10-15 additional longballs in that park alone.

Even if Guerrero’s batting average (which currently hovers around .340) regresses, he is on pace for his ninth career 30-home run season and his 10th 100 RBI campaign. After spending five seasons as a rival of the Rangers, Guerrero is learning that sometimes the grass is greener on the other side.

For more on Vladimir Guerrero and other sluggers, check out Bloomberg Sports’ Fantasy Kits

Mr. Toad’s Wild Ride: Conor Jackson

by Eno Sarris //

It didn’t quite start with a
crash in the library. But Conor Jackson has so far had a career that
resembles the now-defunct Mr. Toad’s Wild Ride.

It all started
so well when he got his first regular playing time in 2006, racking up a .291/.368/.441 line that suggested further upside.
He’d been ranked as high as #17 on Baseball America’s top 100 list and had
shown a .200 ISO in the minor leagues (isolated power, or slugging
percentage minus batting average), so it seemed possible that Jackson
was going to develop into an above-average first baseman despite his
underpowered debut (.151 ISO). At the very least, his nice walk rate (9.7%) could provide good value to his team.

The ride meandered a bit when he followed that up with a .284/.368/.467 season that made fans
wonder if there wasn’t a lot of projectability there. Though he had hit 15 home runs in both seasons,
there was still some hope that he could improve that number in the
future, especially after a solid .183 ISO in his sophomore season.

The 2008 season took most of the shine off Jackson’s future, as his
batting line looked very familiar (.300/.376/.446) and his ISO took a
step back (.146). First base, of all positions, is not a great place to
stick an underpowered stick, as the average batting-title qualifying
first baseman put up a .287/.378/.515 batting line in 2009. But
Jackson still offered value with his batting average, and by playing in
the outfield he added a little quirk and a little spice for people in
deep, five-outfielder leagues.

But last season, things turned for the worse. Jackson caught valley fever, a fungal
affliction seen mostly in the southwest. To quote the Wikipedia entry
on the subject
:

The spores, known as arthroconidia,
are swept into the air by disruption of the soil, such as during
construction, farming, dancing at desert raves, or an earthquake.

Well,
I hope he caught it at a rave, so that some fun came from the situation. The rare disease has mild, flu-like
symptoms, but the fatigue associated with it basically cost Jackson the
year. He amassed just 110 plate appearances in the majors, and a dismal
.182/.264/.253 batting line. It might be safe to call 2009 a bedeviled section of the wild ride for Jackson.

Will there be a return to
normalcy for Jackson? Though claiming to be healthy, he has struggled
to a .245/.331/.343 line. The Bloomberg Sports Fantasy Tools spider
graph shows just how bad such a line is, when stacked up against first
basemen. Jackson is available in 97% of Yahoo leagues and 89.7% of ESPN
leagues. With his mild power even when he was going well, he was easy
to jettison and easier to ignore.
JacksonGrab.jpg

Well,
maybe there are still
fine times coming. Jackson has picked it up in June (.289/.357/.421)
and there are other encouraging signs. He never stopped walking
throughout his troubles (11.4% this year) and his contact rate is right
on target
(87.3% this year, 87.6% career). Now he’s finally hitting the ball with
some authority (27.5% line drive rate).

He probably won’t ever have the power of the average starting first
baseman, he just doesn’t hit the ball in the air enough (34.4% this
year, 40.3% career). But if Jackson can continue to spray line drives
and show his trademark excellent eye at the plate, he can
help in deeper leagues – especially in leagues that count OBP and have five outfielders. Maybe Kevin
Smith was right – maybe everyone does want Mr. Toad’s Wild Ride.

For more on Conor Jackson and other waiver-wire options, check out Bloomberg Sports’ Fantasy Tools.

The Much-Improved Leo Nunez

By R.J. Anderson //

If you guessed that Leo Nunez would be the better pitcher through May than Jonathan Papelbon, then congrats, but you should really use that soothsaying ability on more profitable ventures. It’s true, though, we’re just over one-third of the way through the season and Nunez has 12 saves, a 2.28 ERA, and better strikeout, walk, and home run rates than the venerable Boston reliever.

nunez1.png

The former Royal, acquired by the Marlins after the 2008 season for Mike Jacobs, does it without the prototypical power closer stuff. Yes, he still features a blazing fastball, one that tops 94 miles per hour on average. It’s his secondary stuff that differentiates him. Nunez used to rely on a slider, but the Marlins have coaxed him away from throwing it. Instead Nunez leans heavily on a change-up that sits fewer than 10 ticks away from his heater. FanGraphs has his change-up worth 3.04 runs per 100 pitches thrown. That places it among the most effective pitches in baseball.

Roughly 13% of Nunez’s pitches have resulted in swings-and-misses. If that number improves or holds steady through season’s end, it will represent a career high, breaking the high he set just last season. That’s not the most interesting alteration in Nunez’s game, though. Instead that honor goes to Nunez’s newfound control. His career walks per nine innings rate is 2.86; this year he’s down to 1.90, a number which would net a career best.

Yes, Nunez is on pace for the best season of his career. In 2008, Nunez’s previous best season, he threw nearly 50 innings and posted a 2.98 ERA. Still, his strikeout (4.84) and groundball (39.1%) rates were uninspiring.

Now, though, Nunez’s change has given him a whole new lease on upper-tier life. Nearly 50% of his batted balls against this season have been grounders. When combined with his strikeouts and walks, Nunez has now emerged as one of the top relievers in the National League.

For more on Leo Nunez and other power relief candidates, check out Bloomberg Sports’ Fantasy tools.

Selling Zack Greinke’s 2009 in 2010

By Tommy Rancel //

Going into the 2010 season, B-Rank (Bloomberg Sports’ proprietary ranking system), among many other rankings, tabbed Zack Greinke as a top-five starting pitcher in Major League Baseball. After his Cy Young season in 2009, it was easy to see why. Pitching for one of the worst teams in the majors, Greinke still won 16 games, and racked up 242 strikeouts in 229.1 innings. His 2.16 ERA was nearly identical to his 2.33 FIP (Fielding Independent Pitching) which suggests that he put up these numbers without much luck, and was dominant all year long.

greinke2009.PNG

Thus far this season, Greinke hasn’t been anywhere near the top-five pitcher that many had hoped. For starters, he is just 1-8 through 13 starts in 2010. His ERA is nearly two runs higher than his 2009 mark. As was the case last season, his FIP (3.91) is comparable – as is his 4.18 xFIP (similar to FIP, but also strips out aberrant home run rates). While Greinke’s ERA and FIP are elevated, they remain better than average. But for most fantasy players, that is not enough. What they might fail to notice is this: Greinke’s 2009 season looks like the outlier. His 2010 performance looks very similar to what he’s done throughout the rest of his career.

One of the biggest reasons behind Grienke’s 2009 success was his strikeouts. His strikeouts per nine innings rate (K/9) in 2009 was a career-best 9.50. This year, Greinke has 66 strikeouts in 80 innings, which puts his K/9 at a strong but still significantly lower level of 7.43 – very close to his career 7.59 mark. Also down is his swing-strike percentage. Greinke induced a whiff nearly 10% of the time last season, but sits at just 5.8% this year. On the plus side, this is the only number that’s well below his career level (8.6%)

In terms of walks, Greinke’s BB/9 (walks per nine innings) of 2.03 this year is virtually identical to his 2.0 from a season ago, but still lower than his already impressive career 2.26 level.

Another major difference from last year to this year is home runs allowed. The rightly allowed just 11 home runs last year in nearly 230 innings of work; his HR/9 was a microscopic 0.43. This year he has allowed 10 long balls – nearly matching his total from a season ago in about one-third of the time. On the other hand, his HR/9 in 2010 of 1.13 is much closer to his career level of 0.97 than the number we saw last year.

Looking at his batted ball data – namely batting average on balls in play (BABIP) – Greinke has maintained a relatively normal BABIP in each of the past two years (~.318) when compared to his career number (.315). This further disqualifies luck from the equation.

One slight change in batted ball data is the type of balls being hit. Greinke allowed 40% groundballs last year; that’s down slightly to around 38% in 2010. Conversely, his flyball rate is up nearly 4% year-over-year. With his HR/9 regressing towards a career norm, and more flyballs in general, it’s not surprising to see that his home run-to-flyball ratio (HR/FB%) jump from 4.5% last year to 9.0% this year. Again, the 9.0% is much closer to his career HR/FB% of 8.7%.

When looking at pitch selection, Greinke is throwing more fastballs and change-ups while throwing fewer breaking balls than a year ago. This could be a part of the difference in the two seasons, but we’re talking a relatively minor 3-5% difference on most pitches.

While the 1-8 record is not a true indication of Greinke’s talent level, his 2010 peripheral stats seem to be just that. Greinke appears to be a very good but not quite elite pitcher who enjoyed a career year in 2009. If you can use his name value to acquire a pitcher with similar peripheral stats and a greater chance at more wins (Tommy Hanson?) plus possibly an additional player, you could successfully upgrade your team. 


greinkevhanson.PNG

For more on Zack Greinke and other high-profile starting pitchers, check out Bloomberg Sports’ Fantasy Kits

Cole Hamels: Still the Same Pitcher?

by Eno Sarris //

By traditional statistics, Cole Hamels has oscillated some in his short time in the major leagues:

2006: 4.08 ERA, 1.25 WHIP
2007: 3.39 ERA, 1.12 WHIP
2008: 3.09 ERA, 1.08 WHIP
2009: 4.32 ERA, 1.29 WHIP
2010: 3.98 ERA, 1.37 WHIP

One
could safely say that he’s been an elite pitcher, a good pitcher, and a league-average pitcher if you use the old statistics. Since we do use
the old stats in fantasy baseball, it’s worth noting Hamels’
depreciated value, represented here by spider graphs from the Bloomberg
Sports Fantasy Tools.
Looks like a mediocre year, especially for a “former” top starter.HamelsGrab.jpg

Coming as it does on the heels of his poor
postseason play last year, his performance in 2010 might seem to show
an early decline for the 27-year-old pitcher, at a time when most are
peaking. Then again, less traditional stats have something quite
different to say about Cole Hamels:

2006: 3.98 FIP, 3.68 xFIP
2007: 3.83 FIP, 3.51 xFIP
2008: 3.72 FIP, 3.63 xFIP
2009: 3.72 FIP, 3.69 xFIP
2010: 4.63 FIP, 3.69 xFIP

FIP
is fielding independing pitching, a number that runs on a scale similar to ERA, while stripping out factors such as batted ball luck and bullpen support to get at the underlying ability of a
pitcher to strike batters out and reduce walks. Meanwhile, xFIP is similar but
corrects for home run rates. For example, Hamels this year has a 1.62
HR/9 rate, (1.21 career), but is giving up the fewest flyballs of his
career (36.1% this year, 39.2% career). For some reason, 17.6% of his
fly balls are leaving the park, when it’s usually only 10% that do so across baseball.
By regressing his home run rate towards where it might be if his flyballs acted more like the average flyball, we find
that Hamels has been pretty much the same guy all five years he’s been
in the big leagues. In fact, his xFIP has been remarkably steady.

Then there’s the fact that, in some ways, he’s been better
this year. He’s sporting the second-best strikeout rate of his career,
and the best groundball rate. Those are the two best outcomes a pitcher
can have, so this is not some insignificant change. His fundamental skills are getting
better.

Looking at his pitching mix, one thing does stand out
as being a little different this year. Hamels is using his changeup at
a career-low level (23.7%, vs. 30.6% career). Considering that the pitch is
his best in his arsenal (+68.7 runs career by linear weights, and the
only positive pitch he owns), it seems a bit strange to back off the
changeup. By some systems, he may be tinkering with a cutter, and most
pitching coaches would want their star starters to own more than a
fastball and a changeup. But Hamels’ cutter has been, to date, a negative
(-3.9 runs). The changeup is his major weapon, and he needs to
throw it more often. ESPN’s TMI blog (pay link) even reported that when Cole Hamels
throws 22% or more of his pitches as changeups, his ERA is 3.67
and the Phillies are 6-1. His ERA this year is 4.50 and the team is 1-4 when he doesn’t reach 22% changeups.

Hamels
has basically been the same pitcher his whole career. While he’s
striking out a few more batters this year, and keeping the ball on the
ground a little better, he’s also walking a few too many. Moreover, he needs to
throw his changeup more.

The full picture is one of a pitcher
that has a put-away pitch and a good idea of what he is doing. If you
can acquire Hamels on the cheap, now is the time to do it. Once the
home runs start to normalize, he will push his ERA down towards the mid-3s, improve his WHIP
and be a valuable, front-line fantasy pitcher.

For more on Cole Hamels and other good buy-low pitchers, check out Bloomberg Sports’ fantasy kits