Josh Willingham Laying Down The Hammer in D.C.

By Tommy Rancel //

When the Nationals acquired Josh Willingham and Scott Olsen from the Marlins in exchange for Emilio Bonifacio and a pair of minor leaguers before the 2009 season, it was Olsen who was thought of as the key player in the deal. After all, he was a 24 year-old left-handed starter who had made at least 30 starts in each of the previous three years without a trip to the disabled list.

Will.PNG

Willingham was a throw-in perhaps, a soon-to-be 30 year-old serviceable outfielder with some okay offensive numbers. Marlins President of Baseball Operations, Larry Beinfest admitted money was one of the reasons the deal was made as both players were entering their first year of arbitration.

Things turned out a little differently. Although he escaped the DL in Florida, Olsen has been bit by the injury bug in Washington. He has made just 19 starts since the trade – tossing 105.2 innings with a 4-6 record in two seasons. On the other hand, Willingham has become one of the best offensive players in the National League no one is talking about.

After posting a more than respectable slash line (AVG/OBP/SLG) of .260/.367/.496 with 24 home runs, 61 RBI and 70 runs scored in 2009, Willingham is turning in his best work in 2010. The former catcher is hitting a modest .273; however, he is slugging .502, and is getting on-base at a .405 clip. Both would be career highs for a full-season.

Whenever a player has a breakout season beyond the age of 30, some will assume it is a fluke or an outlier. In a lot of cases this is true. That said, Willingham is on a steady four-year OPS incline suggesting that he maybe nearing – or right at – his career peak.

willops.PNG

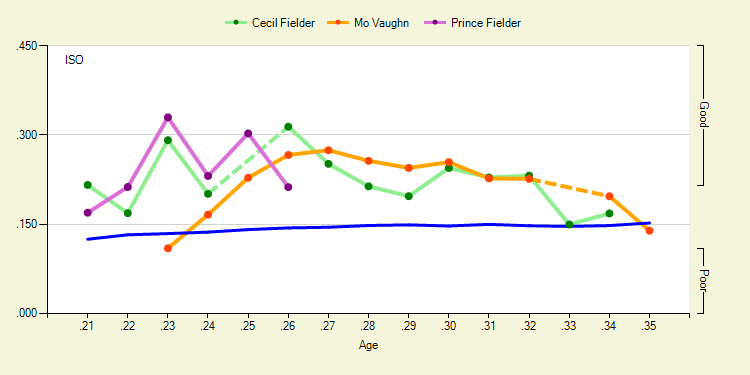
If you are looking for fluke stats – good luck. His batting average on balls in play (BABIP) of .295 is lower than his career .299 number. His ISO (Isolated Power), which indicates raw power by taking slugging percentage and subtracting batting average, is .229, or within 15 points of his career .215 average.

The biggest change for Willingham in 2010 is better plate discipline. He is walking 15.8% of the time (up from 11.5% career), and is striking out slightly less (22.1% in 2010, 23.1% career).

Despite the .907 OPS and a .403 weighted on-base average (wOBA), an advanced metric that measures multiple offensive numbers and is scaled to mirror OBP, “The Hammer” is only owned in 55% of leagues according to hotboxsports.com.

Because of his age and contract status (one more year of arbitration), Willingham could be a trade candidate in both leagues should the Nationals choose to sell. That would make him a slight risk in NL-Only formats. Nevertheless, there is no reason to wait on grabbing him off of waivers – if you’re lucky enough – or through a trade in mixed leagues right now.

For more on Josh Willingham and other breakout candidates, check out Bloomberg Sports Fantasy Tools

(Audio) BTN with Rob Neyer (part 2 of 2)

By Bloomberg Sports //

Listen to part one – (loads in a new browser)
Listen to part two – (loads in a new browser)

This is part 2 of a 2 part interview
Hosts: Wayne Parillo and Rob Shaw
Guest: Rob Neyer of ESPN and Rob Neyer Baseball

Total Running Time: 20:04

Topics

  • Hall of Candidates including Keith Hernandez, Andy Pettitte, and Jamie Moyer
  • The lack of backlash agains greenies
  • The Pesky-Stuart debate

Direct link to the conversation

More ways to get Behind the Numbers, talk to us, or just have a good time

For more on the hottest fantasy baseball topics and trends, check out Bloomberg Sports’ fantasy kits.

Franklin Gutierrez’s 2009 Had a Twin

By R.J. Anderson //

Franklin Gutierrez‘s batting line this season should look familiar for owners who had Gutierrez last season. The 27-year-old center fielder for the Mariners is batting .278/.352/.418, compared to a very similar .283/.339/.425 last season. There have been some changes in Gutierrez’s game, though.

The most notable is his decreased frequency of balls put into play. Gutierrez (featured in the latest edition of “Ballpark Figures”, due up on the site later today) is walking nearly 11% of the time and striking out 26% of the time. Over the last two seasons he’s managed walk rates shy of 7.5% and strikeout rates below 22%. He’s just not swinging the bat as much, and as a result he’s taking some extra walks, but also taking more close pitches for strike three.

However, the added layer of patience hasn’t really affected Gutierrez’s power production. His ISO (slugging percentage, minus batting average) is .139, nearly identical to the last two seasons (.135 and .142). He’s hit seven home runs, and his home run per fly ball percentage (8.3%) is a little below his career average (9.7%), but he’s playing in Safeco Field, which is notorious for handcuffing right-handed batters’ power strokes. See for instance, Adrian Beltre‘s power surge in Boston, after Seattle.

Gutierrez is surrounded by a punchless lineup, despite the recent acquisition of Russell Branyan, meaning his chance at solid RBI totals are greatly diminished. He’s not going to score as many runs as he should either, even though he gets on base at a solid clip. The other cruel reality known well enough to any owner who thought of Gutierrez as the prototypical defensive wizard in center with outstanding range is that Gutierrez rarely steals bags. He’s only stolen 42 in his career, which stretches over 500 major league games.

franklin1.png

There’s nothing all that new to report on Gutierrez’s status heading forward. There’s no reason to abruptly sell Gutierrez, but there’s not much of a reason to rush out and acquire him either. Everything is simply status quo.

For more on Franklin Gutierrez, check out Bloomberg Sports’ Fantasy Tools

var OutbrainPermaLink=’http://bloombergsports.mlblogs.com/wp-content/uploads/2010/07/franklin1-thumb-550×233-21987518.pngarchives/2010/06/why-it-too-early-to-give-up-on-jonathan-papelbon.html’;
var OB_Template = “mlbblogs”;
var OB_demoMode = false;
var OBITm = “1241712535489”;
var OB_langJS =’http://widgets.outbrain.com/lang_en.js’;
if ( typeof(OB_Script)!=’undefined’ )
OutbrainStart();
else {
var OB_Script = true;
var str = ”;
document.write(str);
}

Ian Desmond and Stephen Drew: A Tale of Fantasy Decision-Making

by Eno Sarris //

When you’re in the middle of a cross-country move, you can be forgiven for making some quick decisions about your lineup. Actually, if you ask a certain spouse, you will not be forgiven for ‘wasting time on your fantasy teams when you could be helping with the move.’ Pfft. This is important work here.

In one league, the Fantasy Lounge Roto Champs League, I’ve won two of the past three years — but my team is struggling a little right now. I drafted Alcides Escobar as my shortstop, and even though it took such a late pick that the rest of my team is reasonably strong (up to sixth from last), I’ve been struggling at shortstop and replaced Escobar with Ian Desmond recently. Someone dropped Stephen Drew the other day, though, so I immediately put in the claim for Drew, washed my hands of Desmond, and felt like my team had just gotten much better.

Should I have taken a longer look? These two players sport different approaches and different experience levels. But the results have been very similar. Take a look at the comparison on the right from Bloomberg Sports Fantasy Tools and you’ll see that these are both bottom-echelon fantasy options in standard 12-team mixed leagues. Bloomberg Sports’ new
DesmondGrab.jpg Trade Analyzer rates the move as an average one that improves my team in only two stats.

Desmond is hitting just .247 for the year, with four home runs and six steals to date. It’s not luck on the batted ball keeping him down, as his BABIP is about neutral (.295).

Stephen Drew has fared slightly better from a fantasy perspective. He leads Desmond by a comfortable margin in batting average (.268). The rest of the numbers look similar, though: steals (Desmond leads six to five), runs scored (Drew leads 36 to 27), RBI (Desmond leads 33 to 28) and homers (both have four). Like Desmond, Drew can’t blame his low batting average on BABIP, as he sits at .315. Sound familiar?

While their fantasy stats look alike, there are different players under the hood here. Drew walks twice as much as Desmond and has a track record as a superior power hitter. Drew has a .143 isolated power number (ISO, or slugging percentage minus batting average) while Desmond has put up a .124 ISO. Desmond has struck out at a higher rate (20.7% to 18.0%, ML average is 20.5%) and is reaching outside the zone at a much higher rate (34.9% to 24.7%, ML average is 28.4%). The two players’ 2010 triple-slash stats tell the story:

Drew: .268/.334/.412
Desmond: .248/.287/.372

Frustratingly, though, walk rate is not positively correlated with batting average. So though we know that Drew has more real-life value because of his walks, and we can appreciate his selective approach, we cannot say that a player that walks like he does will necessarily put up a high batting average. Look at Adam Dunn for an anecdotal piece of evidence in that regard. We also know that while Drew has more ISO this year and in the past (.172 career ISO), he’s on a three-year decline in that statistic.

So if you can’t depend on Drew for a strong batting average, his power has been on a decline, and he doesn’t own as much natural speed as Desmond, why is picking up Drew and dropping Desmond a no-brainer? Well, for one, strikeout rate is negatively correlated with batting average, so there’s a notch in Drew’s belt. Another reason has to do with track record. As we wrote in the preseason, Drew has shown the ability to hit for power and batting average in his short career, and at 27 years old, he shouldn’t yet be in his decline.

Finally, Drew’s aggregate offensive numbers, and defense, point to a much better real-life player at this stage of their respective careers. While Desmond and Drew sport similar UZR figures, UZR only becomes a reliable indicator of defensive ability once you have three years of data to peruse. What we do know right now is that Desmond is on pace for more than 40 errors this season, including a recent game in which his sloppy D cost Stephen Strasburg a win. The fact that Desmond is also a rookie means there’s a non-zero chance he’ll be sent back to the minors if he keeps struggling too. 

If you’re looking for a fill-in shortstop in shallower leagues, or a player to hold in deeper ones, choose Drew over Desmond.

For more on Ian Desmond, Stephen Drew, Alcides Escobar, and other shortstop options, check out Bloomberg Sports’ Fantasy Tools.  

Time to give Gordon Beckham and Ian Stewart another chance?

By Eriq Gardner //
Not all fantasy baseball championships are determined by one’s prowess to evaluate player talent and pick winners. Sometimes, competitors suffer bad luck injuries and must demonstrate resiliency and an ability to manage assets when times get tough.
This week, owners of Chase Utley and Dustin Pedroia were knocked hard when both superstars hit the injury shelf. It’s not the first time that high draft investments suffered this fate, but rarely do two top stars at a relatively thin position go down within days of each other.
Certainly, Utley/Pedroia owners will now be looking at the waiver wire to see who might be available. Some owners may contemplate making a trade to fill the gap.
One option might be to acquire Gordon Beckham or Ian Stewart. Both these players have been tremendous disappointments to their own owners this year. In some leagues, they’ve already been dropped and in other leagues, they might be available via trade for a lot less than draft day value.
But do they have any hope of rebound? 
gbeckham.png
Gordon Beckham was fantastic in his rookie season. In just 378 at-bats, he hit .270 with 14 HR and 7 SB. This year, he’s hitting only .209 with just 2 HR and 4 SB.
Beckham is being less selective at the plate this season. His strikeout rate has risen from 17.2% to 20.1% and his walk rate has fallen from 9.5% to 7.1%. That’s largely due to the fact that he’s swinging at pitches outside the strike zone with greater frequency lately. Last year, he was swinging at 25% of pitches outside the zone. This year, it’s up to 31%.
Still, poor luck has also contributed to a miserable average. His line drive rate is roughly similar to last year, yet he’s hitting just .250 on balls hit into play. According to a calculation of Beckham’s xBABIP, it should be .303, offering hope we might see positive movement in Beckham’s batting average going forward.
Beckham’s lack of power is a likewise mix of lackluster skills as well as poor luck. On one hand, he’s hitting less flyballs and making more groundballs this season. On the other, his HR/FB rate stands at just 2.9%. The average player has a rate at about 10%. Beckham’s current HR/FB rate puts him in the category of powerless players like Alcides Escobar and Rajai Davis. With natural regression, we should also see better power numbers from Beckham going forward.
Unfortunately, there’s nothing in Beckham’s peripheral stats that indicate the type of 20/20 season that those who drafted him originally envisioned. But he’s shown the skills at the major league before and is young enough to make adjustments at the plate.
istewart.png
Ian Stewart hit 25 HRs last year and contributed seven stolen bases. He only hit .228, but many hoped that the Rockies infielder’s free-swinging ways would abate with maturity.
So far, it hasn’t happened.
Stewart is striking out 31% of the time this year, which ranks him 9th worst among those who qualify for a batting title. Not that Stewart will be winning one anytime soon. 
This year, Stewart is hitting .248, which would represent a positive development for his fantasy value if he wasn’t aggravating owners by not living up to his power expectations. Stewart has just 9 HRs this season.
Unlike Beckham, poor luck doesn’t seem to be much of a factor in Stewart’s troubles. His BABIP is .316, so if regression is coming, his average might actually fall further. His HR/FB rate is 14.3%, off from his career rate of 16%, but still above league average.
Stewart, though, offers something that Beckham doesn’t — consistently good production in certain situations. As a left-handed batter, Stewart does well when facing right-handed pitching. Eight of his 9 HRs and all five of his steals this season have come against right-handers. If owners have enough roster room and can set their lineups daily, Stewart represents one part of a possible fantasy platoon.
It’s important to also note that both Beckham and Stewart have 3B eligibility on top of 2B eligibility. If either player does manage to turn around their season, this kind of positional flexibility could come in handy when Pedroia or Utley return from their injuries.
For more on options at the second-base position, check out Bloomberg Sports’ Fantasy Tools

Jonathan Papelbon: Buy, Sell or Hold?

By Tommy Rancel //

Despite being one of the majors’ hottest teams, the Boston Red Sox have some concerns. With Josh Beckett and Jacoby Ellsbury already on the shelf, Boston recently lost former American League MVP Dustin Pedroia and star catcher Victor Martinez to the disabled list. In addition to those players, Clay Buchholz is also nursing an injury.

There is plenty to worry about in Boston with that group of players. But any potential concerns about the performance of closer Jonathan Papelbon are premature.

paps.PNG

Anytime a player struggles in a major media market his troubles become magnified. In two straight appearances in Colorado last week, the 29-year-old right-hander allowed five runs on six hits, yielded two three home runs, and blew two straight saves.

The Red Sox closer currently owns a 3.82 ERA in 31 appearances. Papelbon hasn’t posted an ERA over 2.65 in any of his previous five seasons. Outside of the expanded ERA, Papelbon is striking out fewer batters (7.64 strikeouts per nine innings) and walking more batters (3.31 walks per nine innings) than he ever has in a full season. To complete the trifecta, he is allowing home runs to leave the ballpark at a rate more than double his career level.

paps2.PNG

It might seem like it’s time to explore moving Papelbon off your fantasy team. But that’s probably a bad move, especially while he’s at his lowest perceived value. Besides, a number of advanced metrics suggest he will rebound quite favorably.

As mentioned Papelbon’s K/9 has fallen from a career mark of 10.17 per 9 IP to 7.64 in 2010. This is odd for a few reasons. His velocity of 94.6 mph on his fastball is nearly identical to his 94.5 mph career number. In addition to the velocity, Papelbon is still getting a lot of swinging strikeouts. His swinging strike percentage of 11.5% is actually higher than his 11.0% from a season ago.

Papelbon is also getting hitters to chase out of the zone (35.6% O-Swing) more than he has in previous seasons (30.4% O-Swing career). He’s throwing more first-pitch strikes (67.2%) which means he is not falling behind hitters. All signs point to Papelbon’s strikeout rate increasing, if his core skills remain steady.

Papelbon’s biggest problem has been the long ball. He has surrendered more home runs this season (6) than in any other season in his career, and we haven’t even reached the All-Star break. We mentioned that his HR/9 of 1.64 was more than twice his career number (0.73). A big reason for that is his elevated home run-to-flyball rate of 12.2%. For his career, 7.1% of the flyballs hit against him have left the yard. In four of his five previous seasons, he maintained a HR/FB% of 7.5% or less.

More likely than not, Papelbon’s problems are related to pitch location issues. We may also be seeing some outliers due to small sample sizes. With the potential for positive regression in terms of strikeouts, and a correction in the disproportionate rate of home runs allowed, Papelbon should maintain plenty of value. If you own him, remain patient. If you don’t, this may be a good time to trade for Papelbon at a discount.

For more on Jonathan Papelbon and other Boston Red Sox, check out Bloomberg Sports’ Fantasy Tools

The Prince’s Pop

By R.J. Anderson //

Over the last three seasons Prince Fielder has hit 130 home runs; or a home run for every 16.1 plate appearances. This season, though, Fielder has hit 15 homers in 340 trips to the plate; a jack per 22.7 plate appearances. Not only that, but Fielder’s .206 ISO would represent the lowest figure of his career since becoming a full-time player. ISO generally stabilizes after 350 plate appearances; with the season nearly halfway over, is it time to start getting concerned about Fielder’s lacking power?

The first thing most analysts will look for when examining a power loss is the percentage of home runs per fly balls hit. Fielder’s HR/FB% is currently a tick more than 17%. This is lower than expected when compared to his career figure of 20.1%. Even when one breaks Fielder’s rates down on a seasonal basis, it shows that this is a low rate of homers per balls in the air:

2006: 15.8%

2007: 23.9%

2008: 18.2%

2009: 23.1%

Fielder is hitting the same number of flyballs as his career rate and also the same number of groundballs. His batting average on balls in play is relatively steady too, meaning he’s not being robbed on screaming liners in the gap, or at least it doesn’t seem like it. Fielder’s just not having as many balls clear the wall as usual.

Given his big build and specific skill set, some would point to this as the beginning of the end for Fielder’s elite status. That seems overly pessimistic. Fielder is only 26 years old and while his belt is roughly the size of an asteroid belt, that doesn’t mean he’d suddenly lose power.

The popular comparison here would be Mo Vaughn. A barrel-chested, lefty-swinging first baseman with a belly and power who reached the majors at a later point in his career than Fielder, Vaughn enjoyed similar success. He hit at least 25 home runs in every season he recorded 450 or more plate appearances. It was in 2003 that injuries swamped Vaughn’s usefulness and he eventually retired, inconveniently early into his free agent contract with the Mets. But at the age of 26, Vaughn actually posted the best season of his career (to that point) with a slash line of .310/.408/.576. The big man could still hit, and did so into his early 30s.

Cecil Fielder is another popular comparison because, well, come on. Other than bloodlines, the pair don’t share too much in common. Besides, the elder Fielder also recorded the best season of his career as a 26-year-old, blasting 51 bombs for the Detroit Tigers. That suggests an early decline isn’t hereditary, nor is it a given based on his size. As this chart provided from FanGraphs shows, Prince is just having an unusual drop that the other two didn’t experience:

In the end, you should probably just keep Fielder on your roster, barring some unexpectedly massive trade offer. Expect some bounceback, because frankly there’s no reason not to.

For more on Prince Fielder and other power-hitting first basemen, check out Bloomberg Sports’ Fantasy Tools.

(Video) Ballpark Figures: Fantasy Headlines

By Bloomberg Sports //

Ballpark Figures: Fantasy Headlines — Bloomberg Television’s Michele Steele and Bloomberg Fantasy Analyst Rob Shaw recap the weekend in the fantasy baseball scene. Among the topic discussed is the newest curse for the Boston Red Sox.

For the Bloomberg Sports, fantasy tool visit BloombergSports.com.

(Video) Ballpark Figures: Dose of Reality

By Bloomberg Sports //

Ballpark Figures: Dose of Reality — Find out what statistics Major League stars expect to produce in this week’s Ballpark Figures Dose of Reality. Bloomberg Television’s Michele Steele talks some fantasy baseball with Bloomberg Sports Fantasy Analyst Rob Shaw before interviewing Yankees star first baseman Mark Teixeira, Mets rookie phenom Ike Davis, Dodgers speedster Rafael Furcal, and Dodgers star closer Jonathan Broxton. Hear the insight, then go ahead and pick the players up for your fantasy team at Facebook.com/battersboxgame.